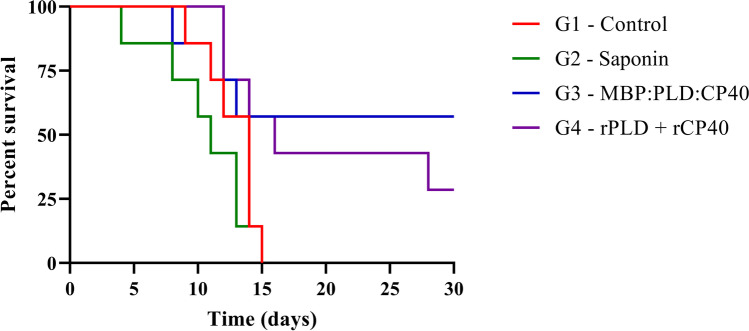
Fig. 6.
Survival curve after experimental challenge with the virulent MIC-6 strain of C. pseudotuberculosis. A 30-days follow-up of seven animals from each group: G1 – Control; G2 – Saponin; G3 – MBP:PLD:CP40 fusion protein; and G4 – rPLD + rCP40. Results are expressed as percent of survival. The G3 and G4 curves were statistically different (p < 0.05) from the G1 and G2 curves, as defined by the Log-rank and Fisher’s tests

