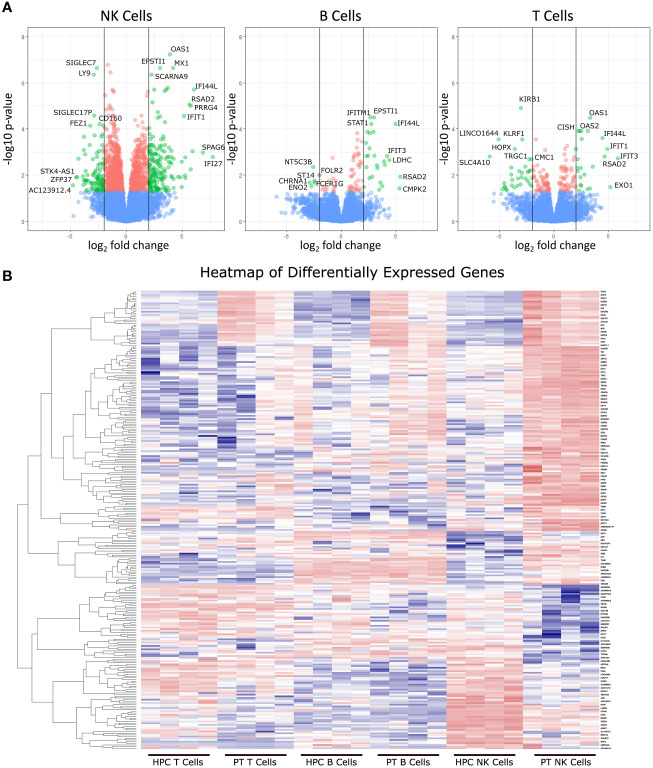
Figure 1.
Differentially expressed genes from JDM new-onset patients compared to healthy pediatric controls. Gene expression in JDM new-onset patients was compared to gene expression in healthy pediatric controls for each cell type to calculate the log fold-change (logFC) and adjusted P value for each gene. Differentially expressed genes were classified as having a greater than 2-log fold change (either positive or negative) and having an adjusted P value of < 0.05 (A). The top three panels depict volcano plots of differentially expressed genes from each cell type comparing JDM patients (PT) to age-matched controls (AMC). Green dots represent differentially expressed genes with an adjusted P value of < 0.05 and a greater than 2-log change in expression. Red dots represent genes with an adjusted P value of < 0.05 but a less than 2-log fold change in expression, and blue dots represent genes with an adjusted P value > 0.05. The bottom panel (B) shows a heatmap of differentially expressed genes (adjusted P value of < 0.05 and a greater than 2-log change in expression) in JDM patient NK cell, T, and B cells compared to immune cells from controls with red and blue representing upregulation and downregulation, respectively.

