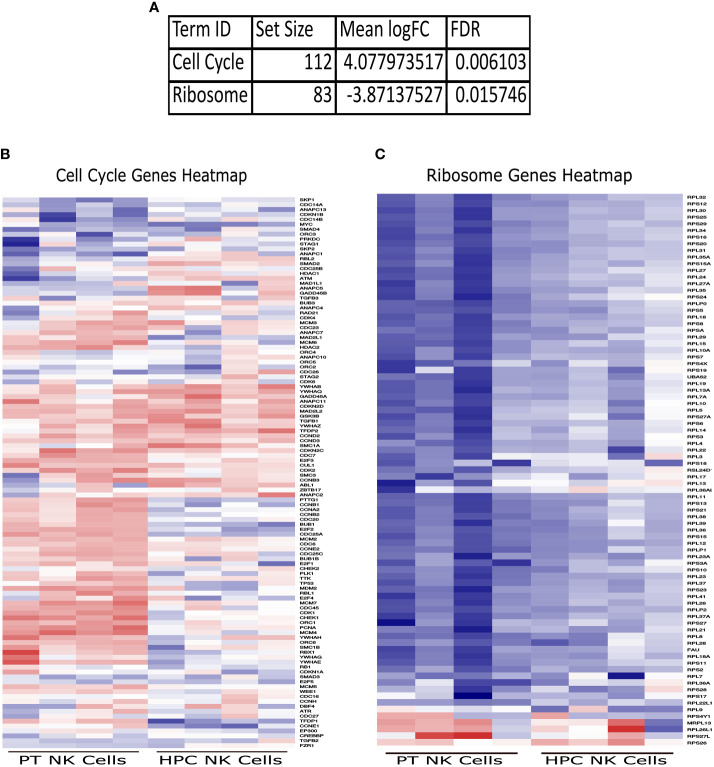
Figure 3.
Significantly upregulated and downregulated GAGE KEGG Canonical Pathway gene sets. (A) Set size, logFC, and FDR for each significantly different gene set. Heatmaps of genes within the Cell Cycle (B) and Ribosome (C) gene sets in JDM patient NK cells and healthy pediatric control NK cells. Red indicates upregulation, while blue indicates downregulation.

