Figure 5.
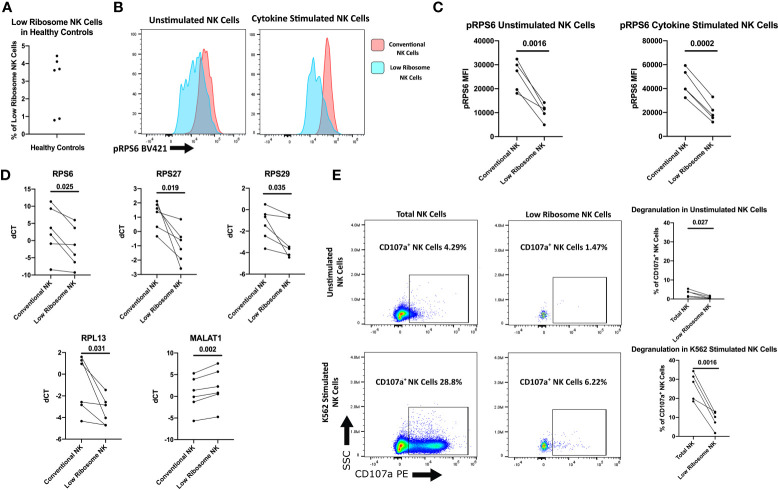
Characterization of the low ribosome expressing NK cell population. Healthy adult donors were used in these experiments. (A) Percentage of low-ribosome expressing NK cells in the total NK cell population measured by flow cytometry with the following markers: CD56+, CD3-, CD18+, CD7-, CD16low, and IFITM1-. (B) Representative histogram of pRPS6 as measured by flow cytometry in low ribosome population compared to the conventional ribosome population: CD56+, CD3-, CD18+, CD7+, and CD16high. (C) pRPS6 in unstimulated and IL-2, IL-12, LPS, IFNαA4, CD16 cross-linking stimulated NK cells in the low ribosome expressing NK population and the conventional NK population. (D) qRT-PCR measurement of ribosomal targets and MALAT1 in sorted populations of low ribosome expressing NK cells and conventional NK cells. dCT was determined by CT of B2M – target CT. (E) Representative flow cytometry plot of CD107a degranulation measured in unstimulated NK cells and NK cells stimulated with target cells in the total NK cell population and low ribosome expressing NK cell population. CD107a+ NK cells in unstimulated and K562 stimulated NK cells of the total NK cell population and the low ribosome expressing NK cell population.

