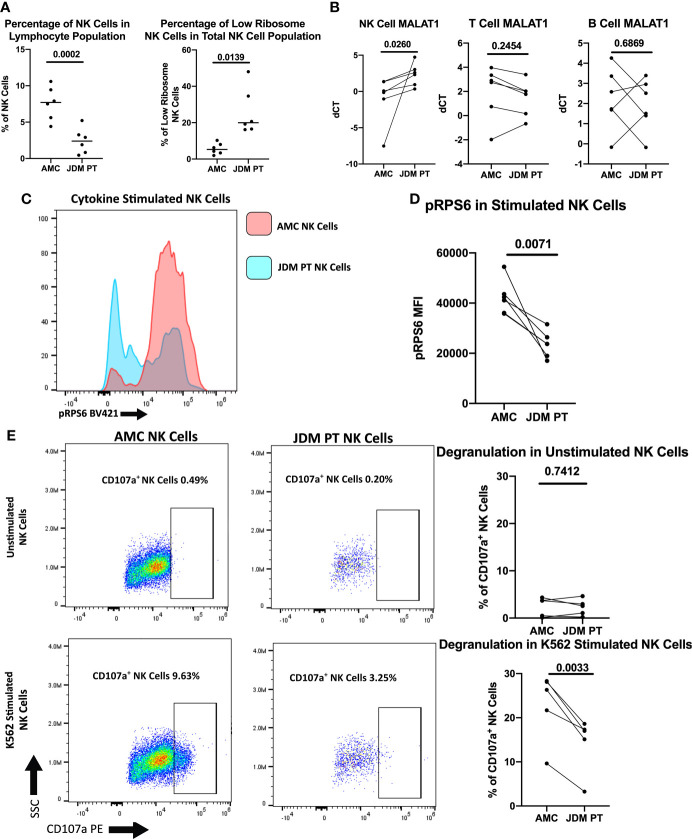
Figure 6.
Comparison of NK cells of treatment-naïve JDM patients and age-matched controls. (A) Percentages of NK cells in total PBMCs and low ribosome expressing NK cells in the NK population in JDM PT and AMC. (B) qRT-PCR measurement of MALAT1 in sorted populations of NK, T, and B cells in treatment-naïve JDM PT compared to AMC. dCT was determined by B2M CT – MALAT1 CT. Representative histogram (C) and MFI (D) of pRPS6 as measured by flow cytometry in stimulated, enriched NK cells from treatment-naïve JDM PT and AMC. (E) NK Cell degranulation of treatment-naïve JDM PT and AMC in enriched NK cells unstimulated or stimulated with K562 cells. A representative flow plot is shown.

