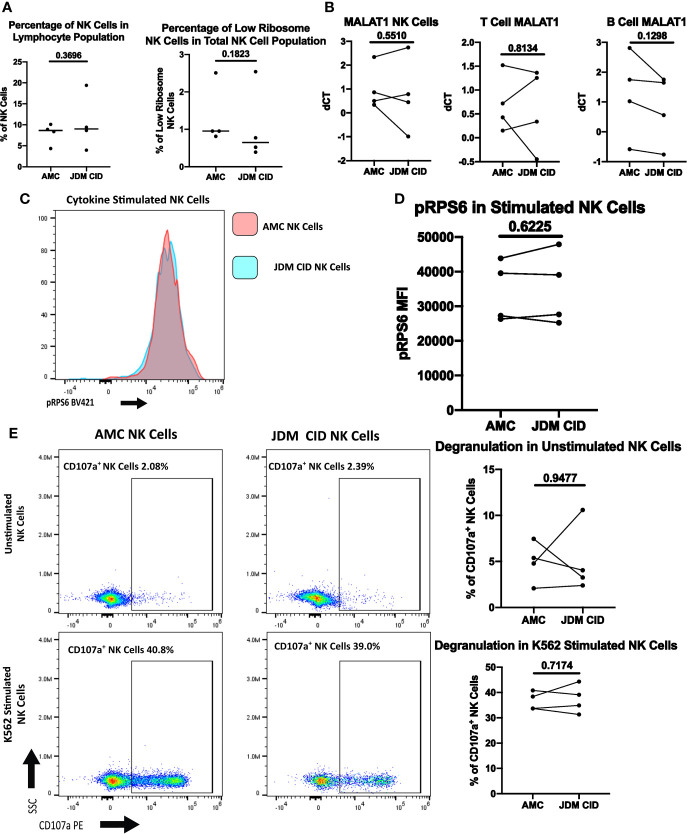
Figure 7.
Comparison of NK cells of clinically inactive JDM patients and age-matched controls. (A) Percentages of NK cells in total PBMCs and low ribosome expressing NK cells in the NK population in JDM PT with clinically inactive disease (CID) and AMC. (B) qRT-PCR measurement of MALAT1 in sorted populations of NK, T, and B cells in JDM CID PT compared to AMC. dCT was determined by B2M CT – MALAT1 CT. Representative histogram (C) and MFI (D) of pRPS6 as measured by flow cytometry in stimulated, enriched NK cells from JDM CID PT and AMC. (E) NK Cell degranulation of JDM CID PT and AMC in enriched NK cells unstimulated or stimulated with K562 cells. A representative flow plot is shown.

