Table 2.
Classification of Donors According to Their PC1/3 Phenotype.
| R < 1 | R > 1 | |||
|---|---|---|---|---|
| 6424 | PB | 0.68 |

|
|
| PT | 0.47 | |||
| 6505 | PB | 0.5 | ||
| PT | 0.7 | |||
| 6314 | PB | 0.7 | ||
| PT | 1.5 | |||
| 6450 | PH | 0.4 | ||
| PB | 0.7 | |||
| 6517 | PB | 0.68 | ||
| PT | 0.76 | |||
| 6123 | PB | 1.7 | ||
| PT | 1.5 | |||
| 6397 | PB | 1.1 | ||
| PT | 0.8 | |||
| 6429 | PB | 1.8 | ||
| PT | 1.1 | |||
| 6520 | PB + PT | 0.46 | ||
| 6362 | PB + PT | 1.7 | ||
| 6325 | PB + PT | 1.4 | ||
| 5000 | PB + PT | 0.5 |
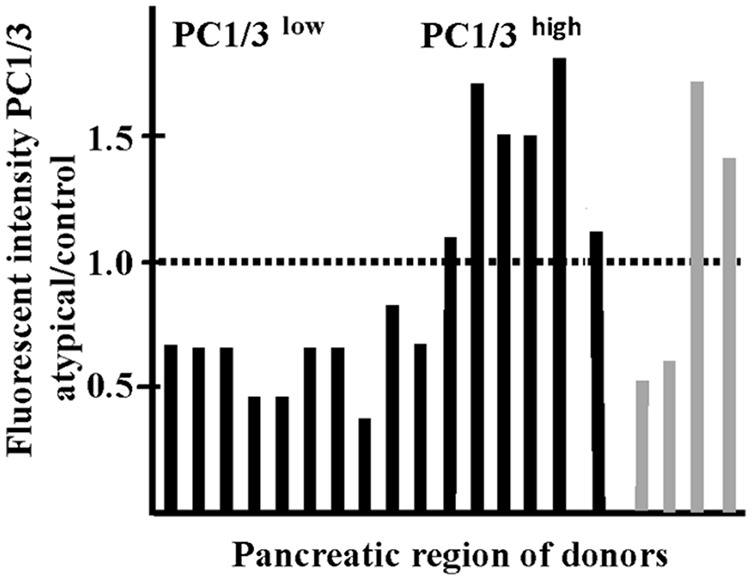
The table illustrates the ratio (R) of the mean fluorescent intensity of PC1/3 per islet area in all islets of each donor over that of control. The same value for control islets was used for all calculations. Note that islets in different regions of the pancreas of autoantibody positive donors are populated by either PC1/3high or PC1/3low beta cells. Islets with PC1/3high and PC1/3low expression do not coexist in the same pancreatic region. At least 15 islets were evaluated for each pancreatic region per donor. Values close to that of control are due to the coexistence of normal and abnormal islets in the same section. Histogram illustrates the values of Table 2. Black lines: autoantibody positive donors; gray lines: type 1 diabetic donors. Note the presence of two abnormal groups according to their PC1/3 phenotype.
Abbreviations: PC1/3, proprotein convertase 1/3; PB, pancreas body; PT, pancreas tail; PH, pancreas head.
