. 2022 Sep 16;28(22):4957–4967. doi: 10.1158/1078-0432.CCR-22-0275

Figure 1.

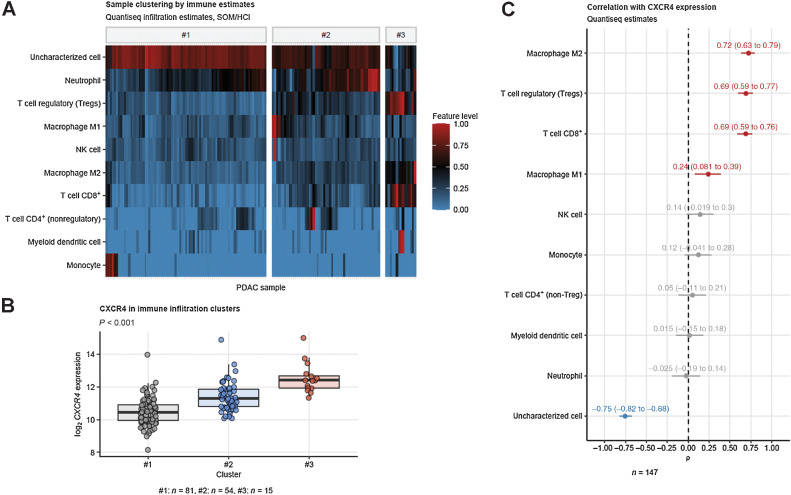
Figure 1. Predominant mRNA expression of CXCR4 in CD8+ and TAM-rich PDACs. Tumor samples were clustered in respect to QuanTIseq immune infiltration estimates with a two-step self-organizing map/hierarchical clustering procedure (Supplementary Fig. S1). Differences in immune infiltration estimates and log2 CXCR4 expression between the three subsets were determined by one-way ANOVA and P values corrected for multiple testing with Benjamini–Hochberg method. A, Values of immune infiltration estimates in the #1, #2, and #3 tumor subsets presented as a heat map. B, log2 CXCR4 expression in the tumor subsets. P value for the expression difference is shown in the plot heading. N numbers of samples assigned to the tumor subsets are provided under the plot. C, Spearman's correlation of the QuaTIseq immune infiltration estimates with CXCR4 mRNA expression. ρ correlation coefficients with 95% CIs are shown for the significant immune feature estimates. Red, positive correlation; blue, negative correlation. N number of observations is indicated below the plot.

Predominant mRNA expression of CXCR4 in CD8+ and TAM-rich PDACs. Tumor samples were clustered in respect to QuanTIseq immune infiltration estimates with a two-step self-organizing map/hierarchical clustering procedure (Supplementary Fig. S1). Differences in immune infiltration estimates and log2 CXCR4 expression between the three subsets were determined by one-way ANOVA and P values corrected for multiple testing with Benjamini–Hochberg method. A, Values of immune infiltration estimates in the #1, #2, and #3 tumor subsets presented as a heat map. B, log2 CXCR4 expression in the tumor subsets. P value for the expression difference is shown in the plot heading. N numbers of samples assigned to the tumor subsets are provided under the plot. C, Spearman correlation of the QuaTIseq immune infiltration estimates with CXCR4 mRNA expression. ρ correlation coefficients with 95% CIs are shown for the significant immune feature estimates. Red, positive correlation; blue, negative correlation. N, number of observations is indicated below the plot.