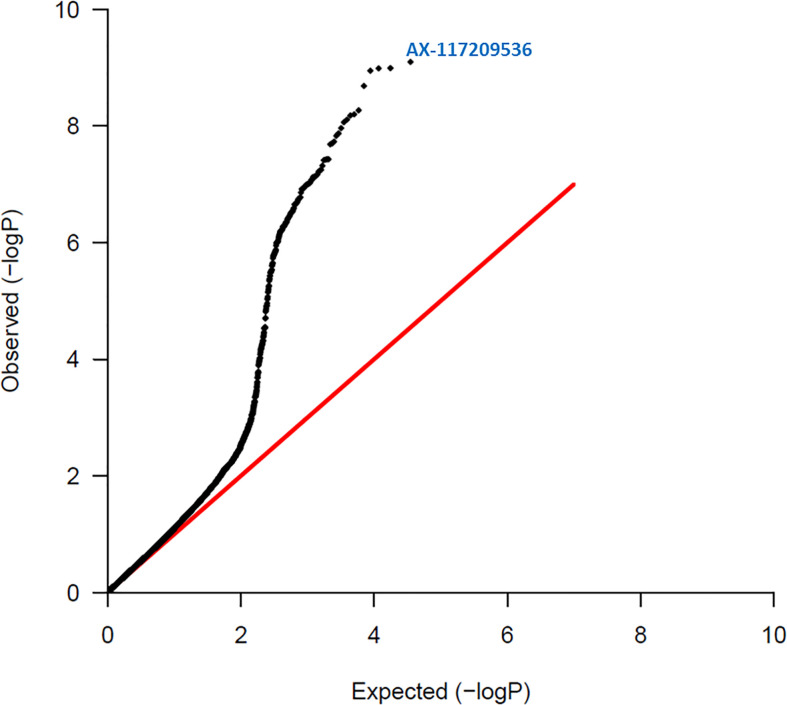
Figure 2.
Quantile – Quantile plot of red rot SNPs. Expected normal distribution of p-values assuming no associations (null hypothesis) is given on the x axis, and the observed p-values on the y axis. The red line indicates the expected trend if observed p-values were normally distributed. The most significant SNP (AX-117209536) is indicated on the figure and was associated with red rot disease at p = 8.00 x 10⁻¹⁰.

