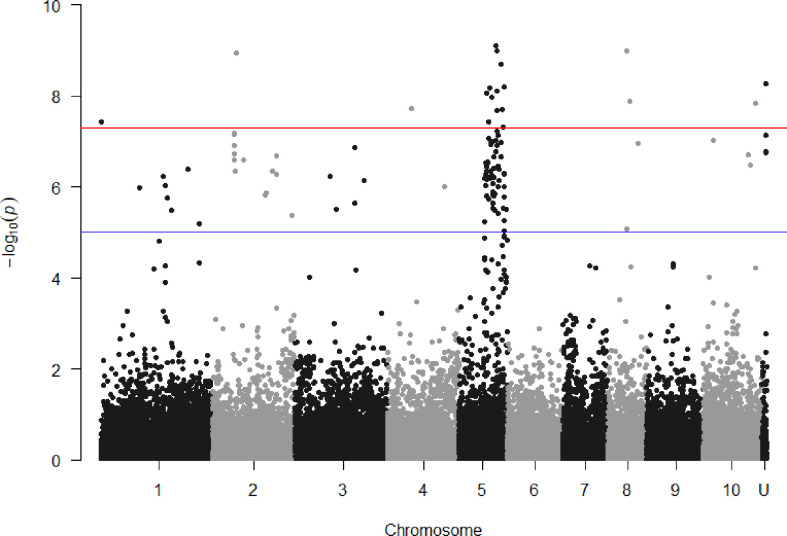
Figure 3.
Manhattan plots showing P value of SNPs obtained from association analysis for red rot resistance score versus locational alignment to the sorghum genome (chromosomes numbered 1 to 10, U indicating no alignment found). For guidance, the red line indicates p = 5x10⁻⁸ and the blue line p = 1x10⁻⁵.

