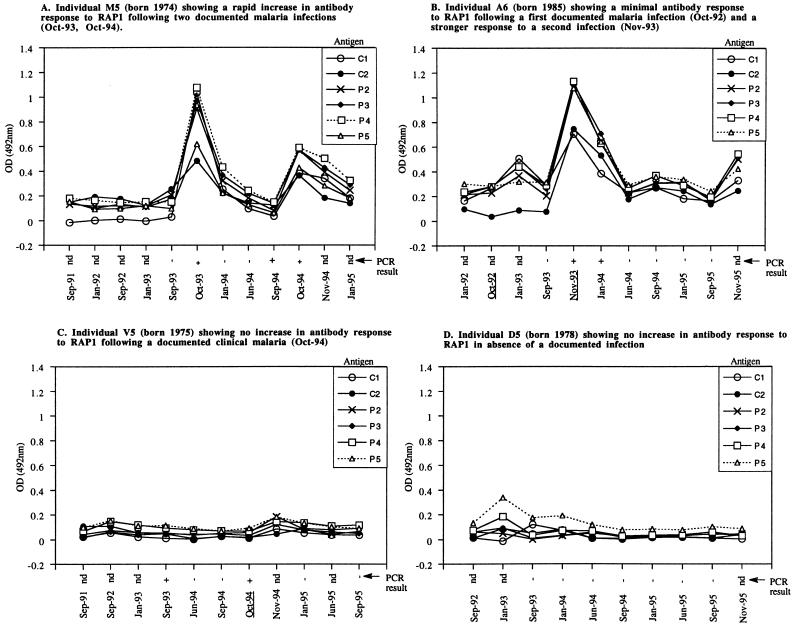
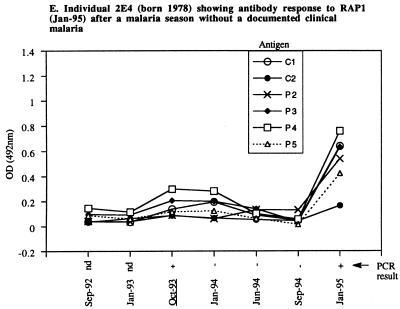
FIG. 3.
Different patterns of IgG antibody responses to RAP1 in natural P. falciparum infections. Each panel illustrates the time course of response(s) of one individual as detected by ELISA with six rRAP1 proteins. The x axes show the month and the year when each test sample was collected. Dates of samples collected during documented episodes of clinical malaria are underlined. PCR results, also along the x axes, indicate the absence (−) or presence (+) of P. falciparum in blood samples of each individual. nd, PCR was not done.


