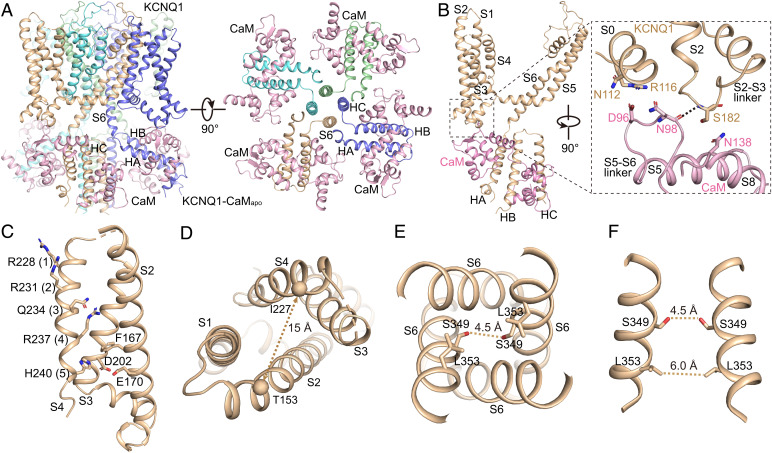
Fig. 3.
The structure of KCNQ1-CaMapo. (A) The cartoon model of KCNQ1-CaMapo in the side view (Left) and top view (Right). Each subunit of KCNQ1 is colored individually, and the CaM is in pink. The TMD of KCNQ1 is not shown in the top view. (B) Interactions between the VSD of KCNQ1 and CaM. The dashed line shows the hydrogen bond between KCNQ1 and CaM. (C) The VSD structure of KCNQ1-CaMapo with S1 omitted for clarity. Side chains of gating charge residues and residues forming the CTC are shown as sticks. (D) A large solvent-accessible cavity formed in the extracellular side of VSD. The dashed line shows the distance between Cα atoms of Thr153 in S2 and Ile227 in S4 (in Å). (E) The pore domain of KCNQ1-CaMapo. The dashed line shows diagonal atom-to-atom distances between two Ser residues. (F) Ser349 and Leu353 form two constriction layers in the closed activation gate of KCNQ1-CaMapo. The dashed lines show diagonal atom-to-atom distances between two Ser and Leu residues (in Å).

