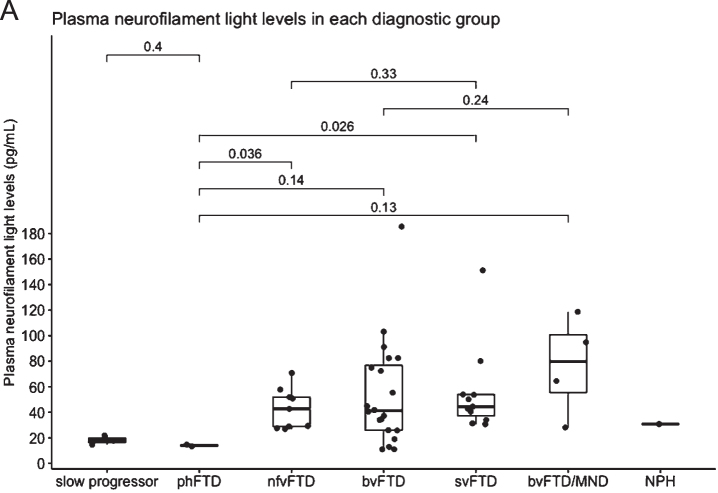
Fig. 2.
A) Plasma neurofilament light in each diagnostic group. Median NfL is represented in the boxplot by the thick line. The 1st and 3rd quartiles are represented by the hinges. The lower and upper whiskers indicate the smallest and largest NfL value that are 1.5 times the interquartile range, respectively. NfL values beyond the end of the whiskers are plotted individually. P values using the Wilcoxon rank sum test between the median NfL for phFTD and each diagnostic group is shown. slow progressor, slowly progressive bvFTD; phFTD, frontotemporal dementia phenocopy; nfvFTD, non-fluent variant frontotemporal dementia; bvFTD, behavioral variant frontotemporal dementia; svFTD, semantic variant frontotemporal dementia; MND, motor neuron disease; NPH, normal pressure hydrocephalus.

