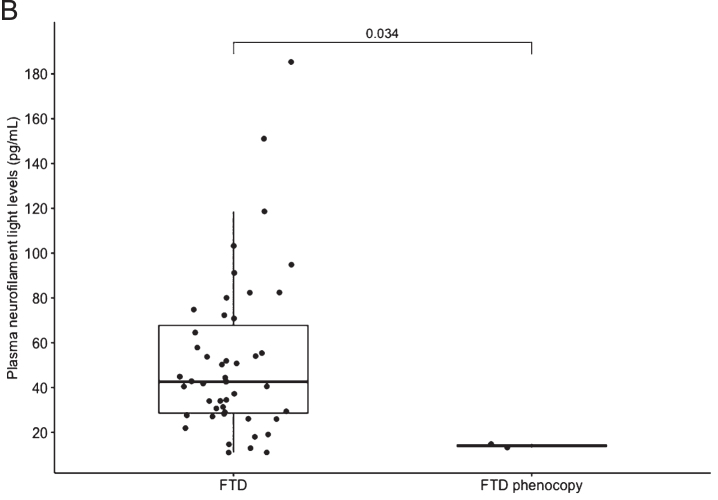
Fig. 2.
B) Boxplot of all FTD versus FTD phenocopy. Median NfL is represented in the boxplot by the thick line. The 1st and 3rd quartiles are represented by the hinges. The upper and lower whiskers indicate the smallest and largest NfL value that are 1.5 times the interquartile range, respectively. NfL values beyond the end of the whiskers are plotted individually. The p value using the Wilcoxon rank sum test between the median NfL for FTD phenocopy and all FTD syndromes is shown. FTD, frontotemporal dementia

