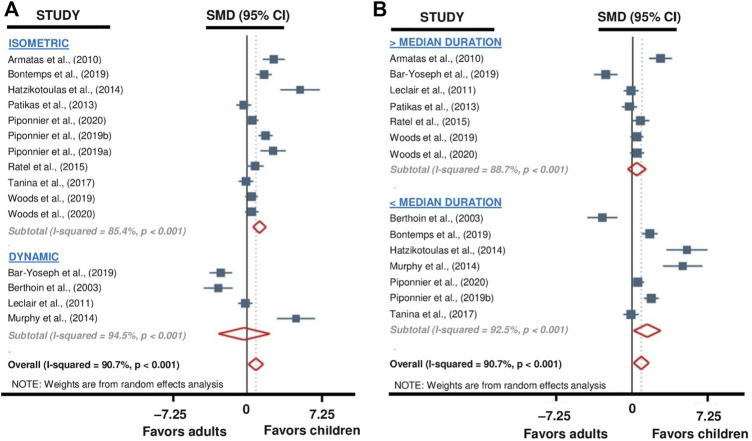
FIGURE 3.
Forest plot from the subgroup meta-analysis reporting the influence of 1) exercise modality (i.e., isometric or dynamic; (A) and 2) exercise duration (B) on TTF differences between children and adults. Raw SMDs (with 95% confidence intervals) and % weights of the meta-analyzed studies are given in Figure 2.

