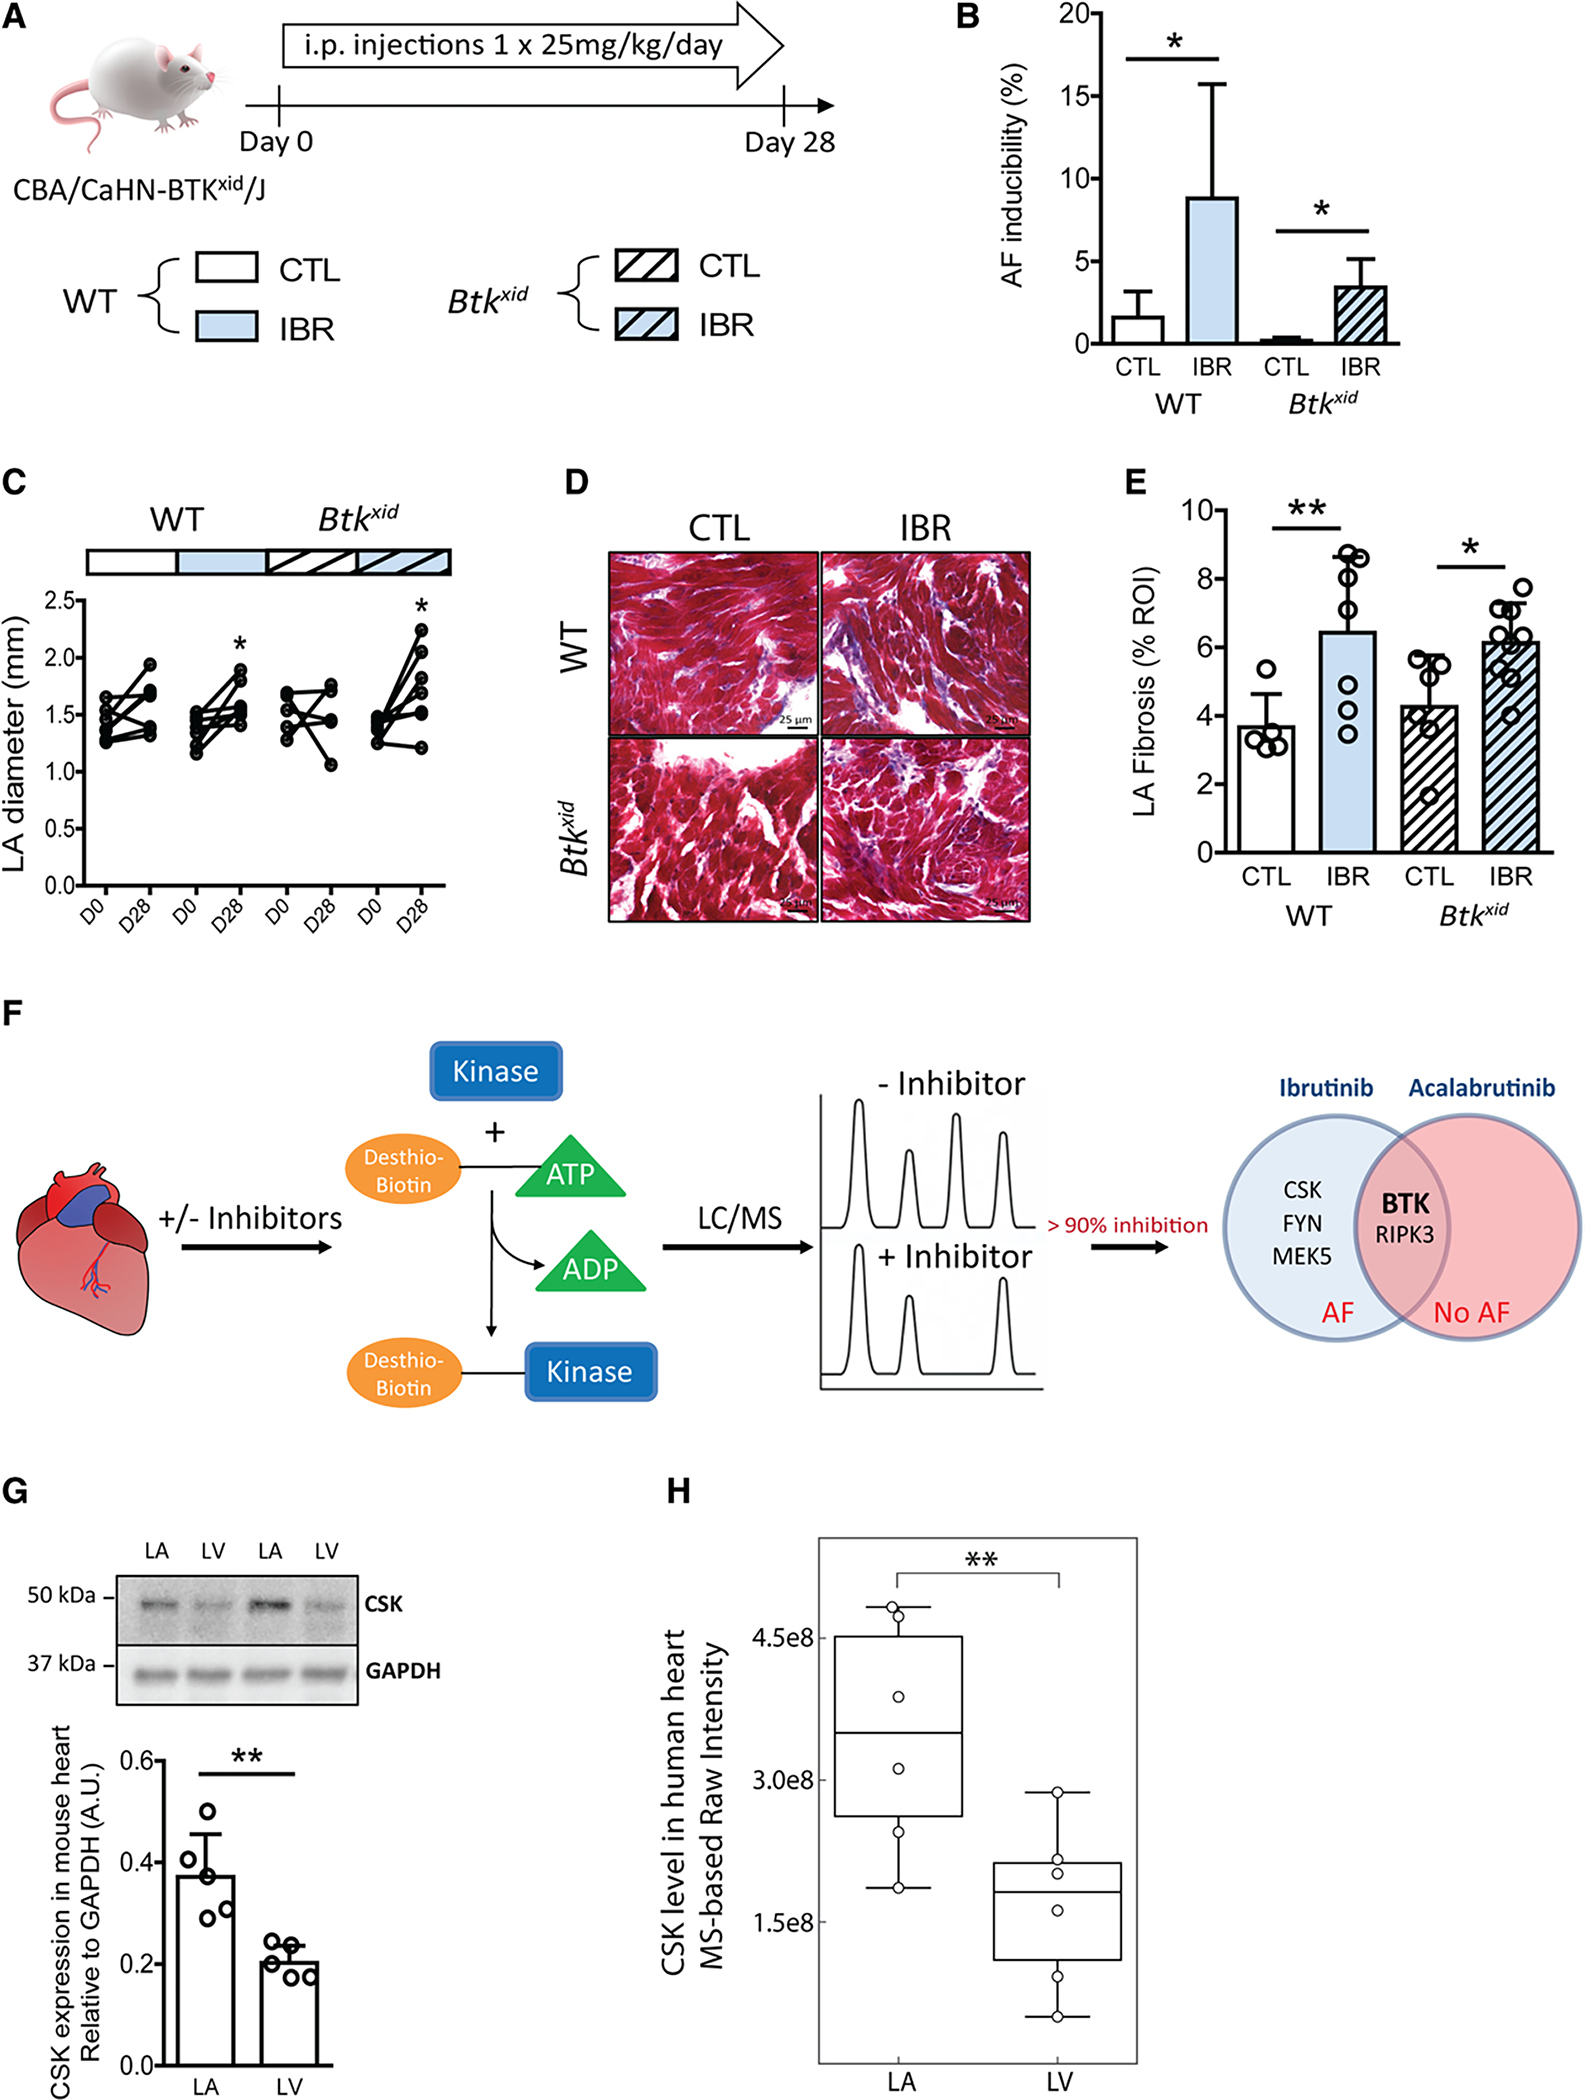
Figure 2. Ibrutinib causes atrial fibrillation through off-target effects.

Evaluation of ibrutinib effects on mice lacking BTK. A, Experimental outline of ibrutinib administration in BTK mutant CBA/CaHN-BTKxid/J mice lacking active BTK (Btkxid) and strain-matched wild-type CBA/CaJ (WT). Mice received intraperitoneal injection of ibrutinib (IBR) or vehicle (CTL) at 25 mg·kg−1·d−1 for 4 weeks (28 days), followed by in vivo electrophysiology studies. B, AF inducibility in WT and Btkxid after 4-week ibrutinib or vehicle treatment. Data are mean±SEM percentage of successfully induced atrial arrhythmia episodes during invasive EP studies in WT CTL, n=5, WT IBR, n=7, Btkxid CTL, n=6, and Btkxid IBR n=8 mice. *P<0.05, Fisher exact test. C, Data are LA diameters measured by echocardiography before (D0) and after 4 weeks (D28) of ibrutinib (IBR) or vehicle (CTL) injections in WT and Btkxid mice (n=7 mice in WT CTL; n=7 in WT IBR; n=5 in Btkxid CTL; n=8 in Btkxid IBR). *P<0.05, D0 vs D28, paired Student t test. D, Representative sections of Masson trichrome stain of LA fibrosis in CTL and IBR of WT and Btkxid mice. E, Mean±SEM LA fibrosis levels (%) in LA sections of WT CTL (n=5 regions of interest from 2 mice), WT IBR (n=7 from 3 mice), Btkxid CTL (n=6 from 3 mice), and Btkxid IBR (n=9 from 4 mice). *P<0.05, ** P<0.01, 1-way ANOVA with Sidak posttest. F, Workflow of chemoproteomic kinase profiling of ibrutinib and acalabrutinib targets in mouse heart. Five kinases and 2 kinases detected to be inhibited by >90% were identified as ibrutinib or acalabrutinib targets in the heart. A Venn diagram shows the overlap of 2 kinases inhibited by both ibrutinib and acalabrutinib. G, Mean±SEM CSK protein levels normalized to GAPDH levels in paired LA and LV tissues from adult wild-type C57BL/6J mice (n=5 mice; bottom). **P<0.01, paired Student t test. CSK protein is detected at ≈50 kDa on Western blot (top). H, The expression level of CSK in human heart was evaluated from MS-based protein intensity measurements performed on heart biopsies collected from LA and LV from 6 living humans. Normalized raw intensities measured for CSK are shown. Individual measurements from LA or LV are depicted dots. The relative protein expression levels of CSK in atrial and ventricular biopsies were compared by a paired Student t test. P=0.009. The box in the box-and-whisker plot shows the quartiles of the dataset while the whiskers represent the CI (95%) by bootstrapping. AF indicates atrial fibrillation; BTK, Bruton tyrosine kinase; CSK, c-Src terminal kinase; GAPDH, glyceraldehyde 3-phosphate dehydrogenase; i.p., intraperitoneal; LA, left atria; LC, liquid chromatography; LV, left ventricle; and MS, mass spectrometry.
