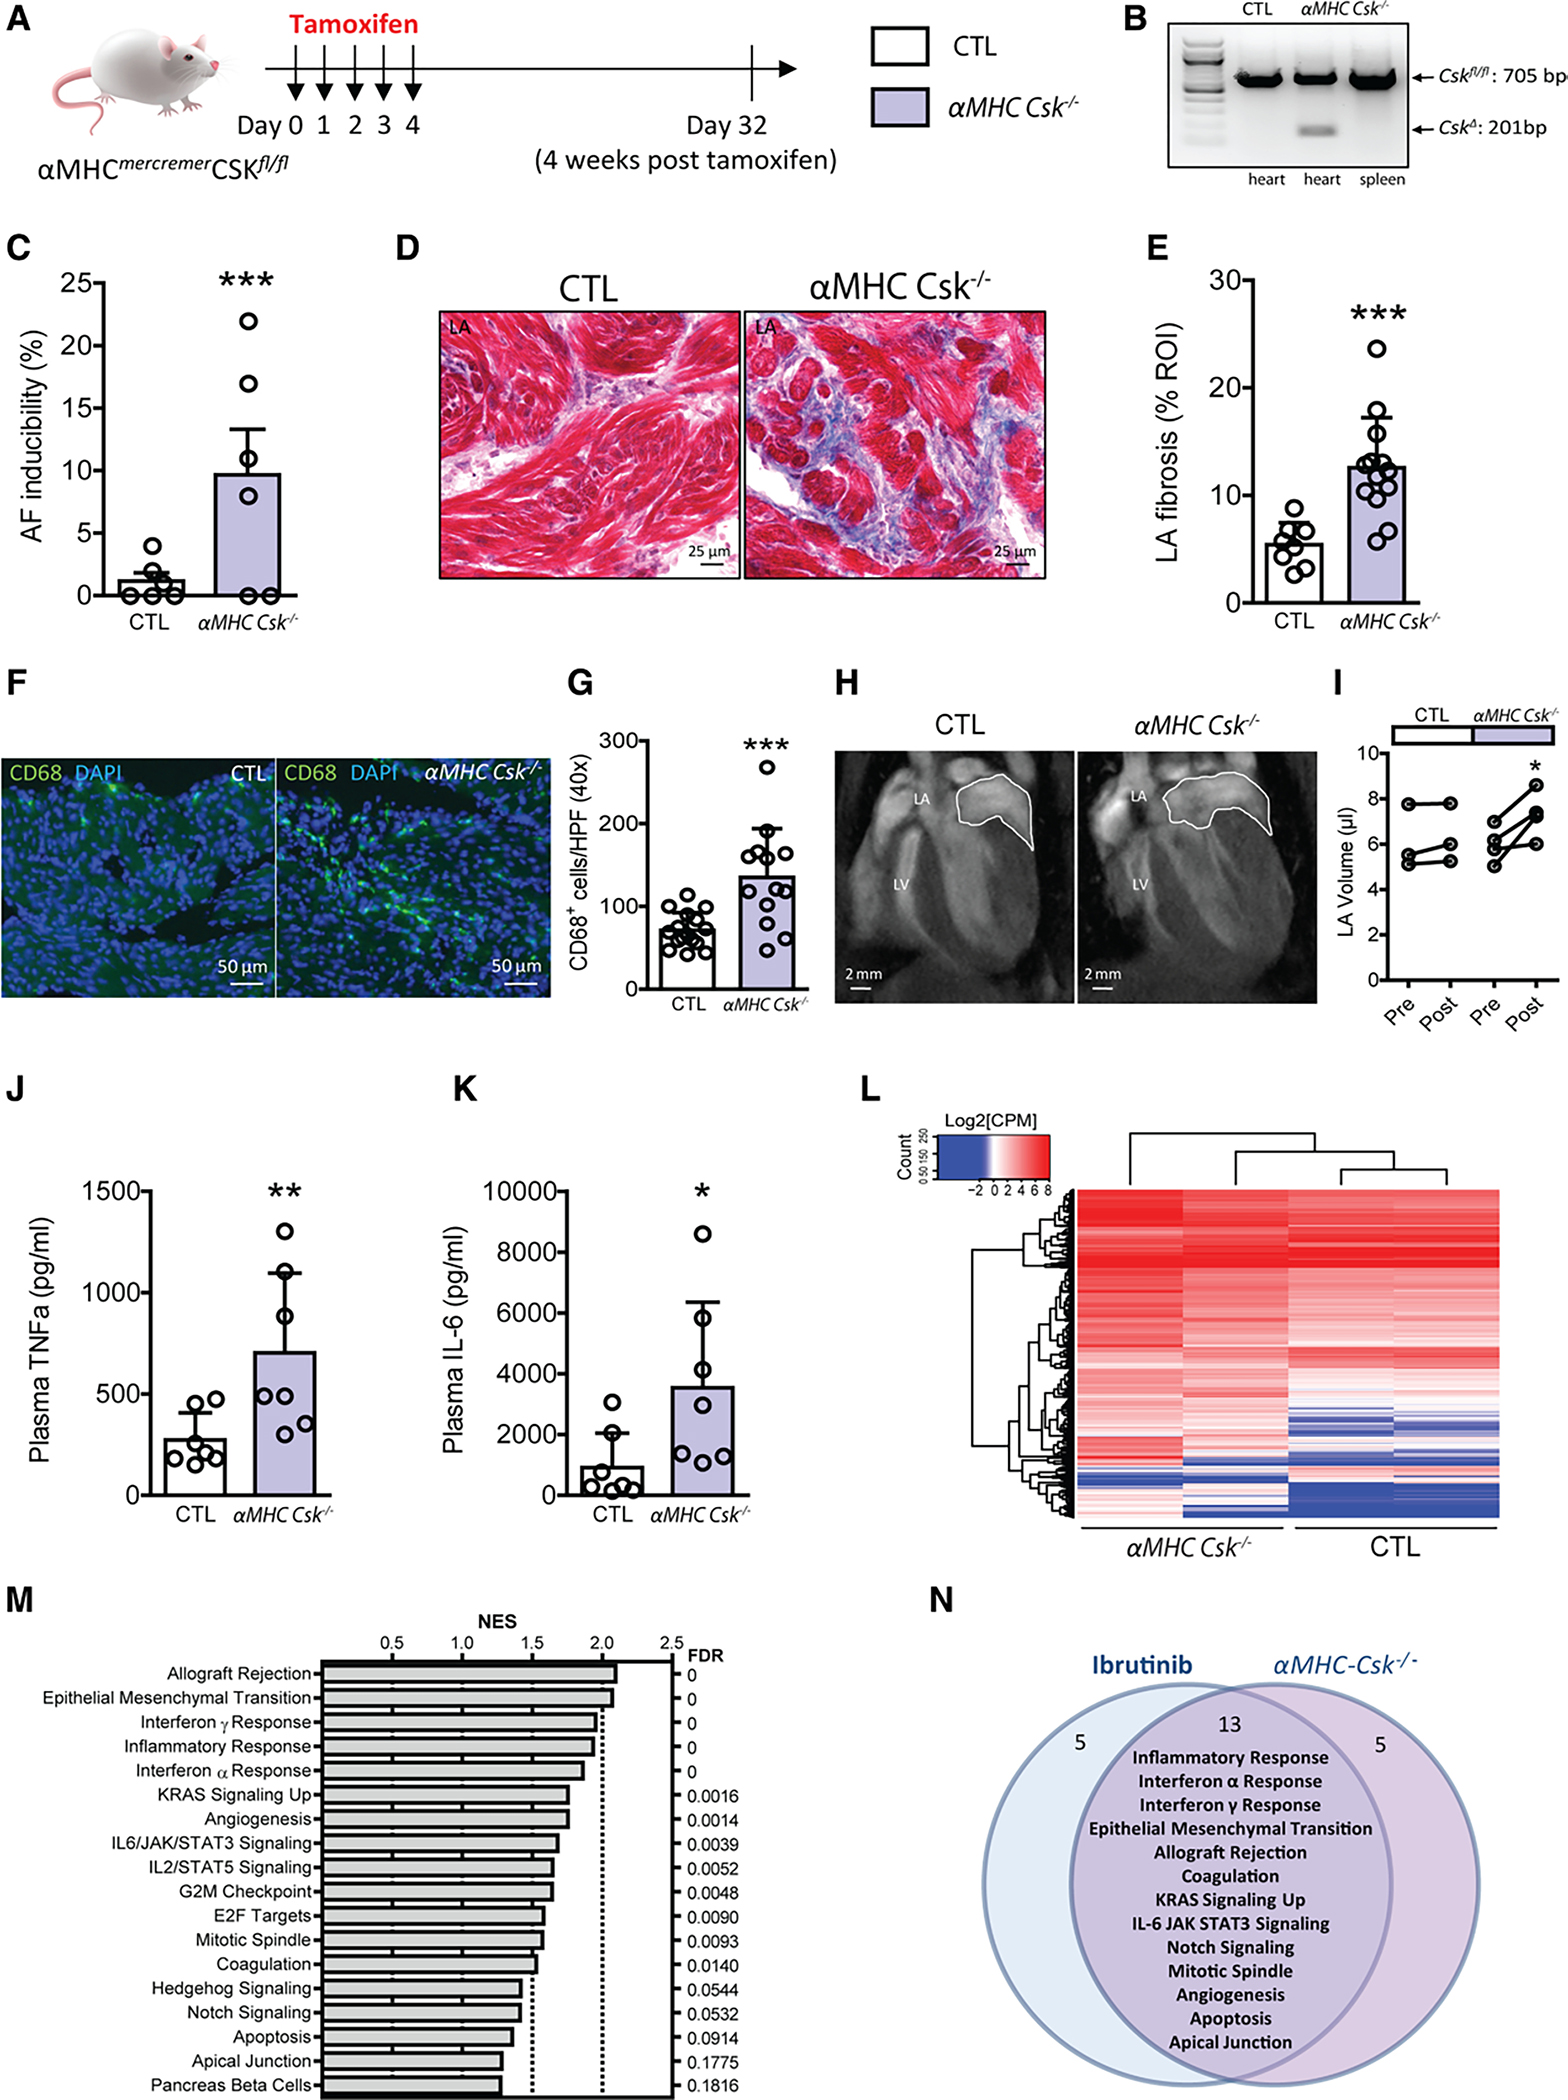
Figure 3. Cardiac-specific knockout of CSK causes AF and increases LA interstitial fibrosis, LA size, CD68+ macrophages, and plasma TNFα and IL-6 levels.

A, Experimental outline. Cardiac specific deletion of Csk was induced in αMHCmercremer Cskfl/fl mice after 5 daily doses of tamoxifen injection (αMHC Csk−/−). Littermate Cskfl/fl mice receiving the 5-dose tamoxifen treatment were used as control (CTL). In vivo electrophysiology studies were performed on day 32, 4 weeks after the last dose of tamoxifen. B, Polymerase chain reaction analyses of Cskfl/fl (CTL) and αMHCmercremerCskfl/fl (αMHC Csk−/−) heart and spleen tissues 4 weeks posttamoxifen show cardiac specific deletion of Csk allele (CskΔ) in αMHC Csk−/− mice. C, Atrial fibrillation inducibility in CTL and αMHC Csk−/− mice 4 weeks after tamoxifen treatment. Data are mean±SEM percentage of successfully induced atrial arrhythmia episodes during invasive EP studies. n=6 mice per group, ***P<0.0001, Fisher exact test. D, Images of Masson trichrome stain of LA fibrosis in CTL and αMHC Csk−/− mice. E, Mean±SEM LA fibrosis levels (%) in LA sections of CTL (n=8 ROIs from 3 mice) and αMHC Csk−/− (n=13 from 3 mice) mice. ***P<0.0001, unpaired Student t test. F, Immunofluorescence images of LA sections stained for CD68 (green) and DAPI(blue) in CTL and αMHC Csk−/− mice. G, Quantification of CD68+ cells in LA sections of CTL (n=16 HPFs from 3 mice) and αMHC Csk−/− (n=13 from 3 mice). Data are mean±SEM; ***P<0.0001, unpaired Student t test. H, Representative cardiac magnetic resonance images of CTL and αMHC Csk−/− mice. I, Data are LA volumes obtained by cardiac MRI on CTL and αMHC Csk−/− mice before and 4 weeks posttamoxifen treatment (n=3 mice for CTL and n=4 mice for αMHC Csk−/−). Data are mean±SEM, *P<0.05, paired Student t test. J and K, Quantification of plasma TNFα (J) and IL-6 (K) levels in CTL (n=7) and αMHC Csk−/− (n=7) mice. Data are mean±SEM, *P<0.05, ** P<0.01, nonparametric Mann–Whitney test. L, Heatmap of expression levels of 896 differentially expressed genes from RNAseq data of 2 CTL and 2 αMHC Csk−/− LA tissues. M, Gene set enrichment analysis shows 18 differentially regulated categories/pathways in LA after cardiac Csk knockout. Barplot of gene set enrichment analysis NES with false discovery rate on the right. N, A Venn diagram shows the overlap of 13 differentially regulated gene categories/pathways between ibrutinib-treated mice and cardiac Csk knockout mice. AF indicates atrial fibrillation; CPM, counts per million; CSK, C-terminal Src kinase; DAPI, 4′,6-diamidino-2-phenylindole; HPF, high power fields under 40× objective; LA, left atria; NES, normalized enrichment score; and ROI, region of interest.
