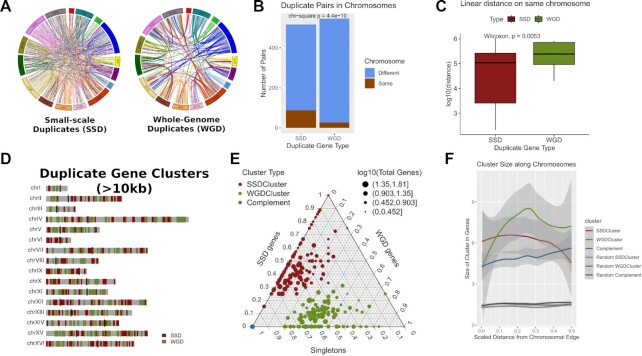
Figure 1.
Duplicate genes segregate into different regions of the yeast genome. (A) Circos Plots joining gene duplicate pairs in the yeast genome. Left: Whole Genome Duplicates (WGD), Right: Small-Scale Duplicates (SSD). Light blue lines join duplicate pairs on different chromosomes, while brown lines join pairs located on the same chromosome. (B) Number of gene duplicate pairs found on the same or on different chromosomes. (C) Distribution of linear distances (log10-transformed) between gene duplicate pairs that are located on the same chromosomes. (D) Genome domainogram showing the locations of gene duplicate clusters along the sixteen chromosomes of the yeast genome. For reasons of clarity, only clusters with length greater or equal to 10kb are shown. (E) Ternary plot showing the gene content of duplicate and complement clusters. The scale on each side of the triangle is relative and corresponds to the gene content in one of SSD, WGD and singleton gene categories. The colour of the dots corresponds to the cluster type. As all Complement Clusters contain exclusively singleton genes they all converge to one point at the lower left vertex of the plot. Size of the points corresponds to the size of the cluster in total number of genes. Notice how SSD and WGD clusters are occupying different parts of the plot, suggestive of their relative purity in duplicate genes of a specific type. (F) Composite plot of actual and random duplicated gene clusters showing the average cluster size (in number of genes) along a scaled distance from the chromosomal edge. Shaded bands correspond to standard error of the mean.

