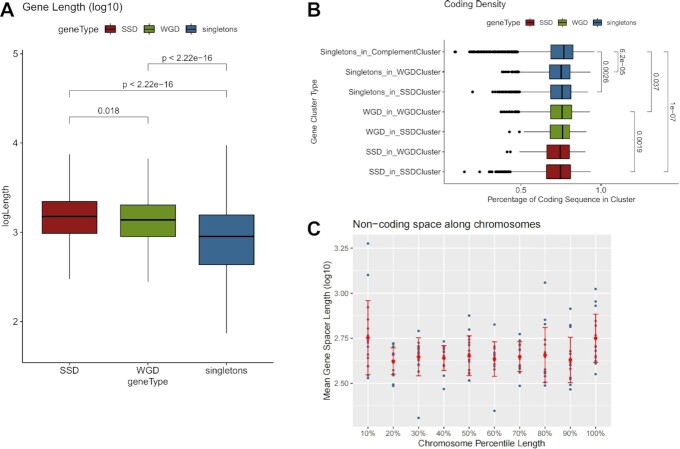
Figure 2.
Gene duplicates are localized in areas with more extended non-coding space. (A) Distribution of gene lengths (log10-transformed) for SSD, WGD and singleton genes. Significance is denoted with adjusted p-values of a Mann–Whitney test. (B) Distribution of coding density for regions around genes from different gene clusters (see text for details). Significant differences are denoted with adjusted P-values of a Mann–Whitney test. (C) Mean gene spacer length (log10-transformed) along 10 quantiles in each of the sixteen yeast chromosomes. Dots correspond to mean values for the given percentile for each chromosome. Red bars correspond to standard deviation.

