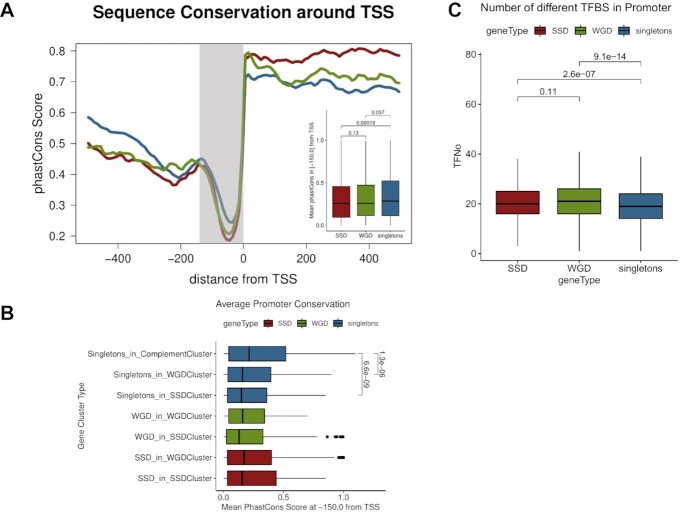
Figure 3.
Sequence constraints are more relaxed in the promoters of duplicate genes. (A) Aggregate mean conservation (phastCons) along a region spanning 500 bp either side of TSS for singleton, SSD and WGD genes. Embedded boxplot represents mean phastCons scores for the highlighted, proximal promoter region (150 bp upstream to TSS). Values in brackets correspond to adjusted P-values of a Mann–Whitney test. (B) Distribution of mean conservation in the proximal promoter region (150 bp upstream to TSS) measured as mean phastCons scores for different gene clusters. Values next to brackets denote adjusted P-values of a Mann–Whitney test. (C) Distributions of numbers of predicted transcription factor binding sites (TFBS) in the gene upstream regions (300 bp upstream to TSS) for SSD, WGD and singleton genes. TFBS obtained from a set of predictions based on comparative sequence analysis (48).

