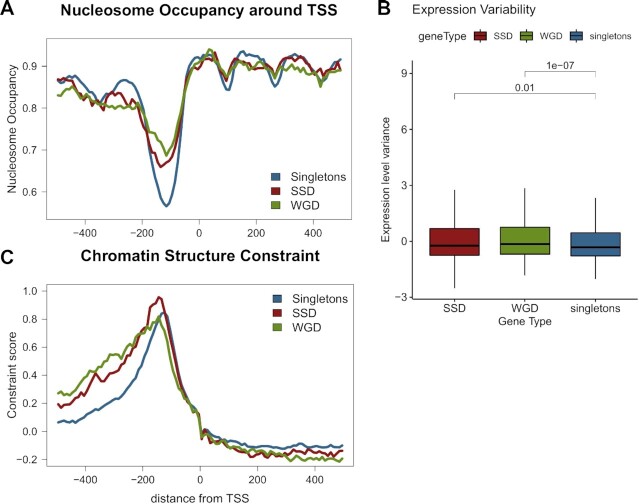
Figure 4.
Nucleosome positioning patterns in gene duplicates suggest more complex promoter structure. (A) Mean nucleosome occupancy along a region spanning 500 bp either side of TSS for singleton, SSD and WGD genes. Nucleosome occupancy was calculated in one hunded 10 bp bins, as the fraction of the region overlapping a positioned nucleosome. Positions obtained from (47). (B) Distribution of expression variability for SSD, WGD and singleton genes. Expression variability was assessed as the z-score of the variance of gene expression values from the SPELL database. Values over brackets denote adjusted P-values of a Mann–Whitney test. (C) Chromatin structure constraint score as measured with the mutation score (45) along a region spanning 500 bp either side of TSS for singleton, SSD and WGD genes.

