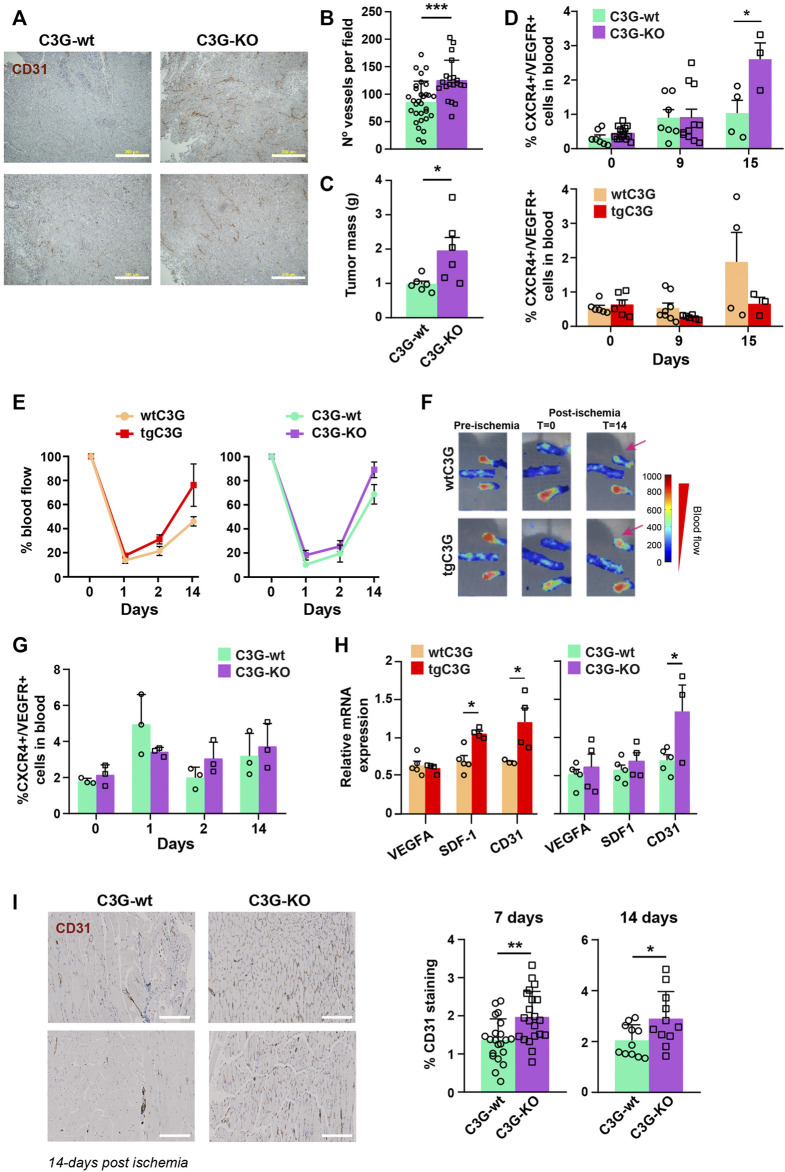
FIGURE 1.
Platelet C3G regulates ischemia-induced angiogenesis. (A) Representative images of 3 LL tumor sections, from C3G-wt and C3G-KO mice, showing vessel density detected by CD31 staining. Bar: 200 μm. (B) Quantification of the number of vessels per field (0.65 mm2) in tumor sections (Mean ± SEM). (C) Mean ± SEM of the tumor mass (in grams). (D). Mean ± SEM of the percentage of hemagiocytes (CXCR4/VEGFR double-positive cells). (E) Doppler values represented as the mean ± SEM of the percentage of blood flow (n = 6 tgC3G and wtC3G, n = 3 C3G-KO and C3G-wt). (F) Representative Doppler images at the indicated times. The color scale represents the blood flow values. (G) Mean ± SEM of the percentage of CXCR4/VEGFR-double positive cells in blood from C3G-KO and control mice at the indicated times post-ischemia. (H) RT-qPCR analysis of VEGFA, SDF-1 and CD31 mRNA expression in homogenates of murine muscle from the indicated genotypes at day 14 post-ischemia. Values are relative to β-actin expression and were normalized against the corresponding value in the contralateral (non-ischemic) leg. (I) Left: representative images of ischemic leg sections of C3G-wt and C3G-KO mice, showing vessel density detected by CD31 staining. Bar: 200 μm. Right: mean ± SD of the percentage of positive pixels for CD31 staining, relative to the total number of pixels. *p < 0.05; **p < 0.01; ***p < 0.001.

