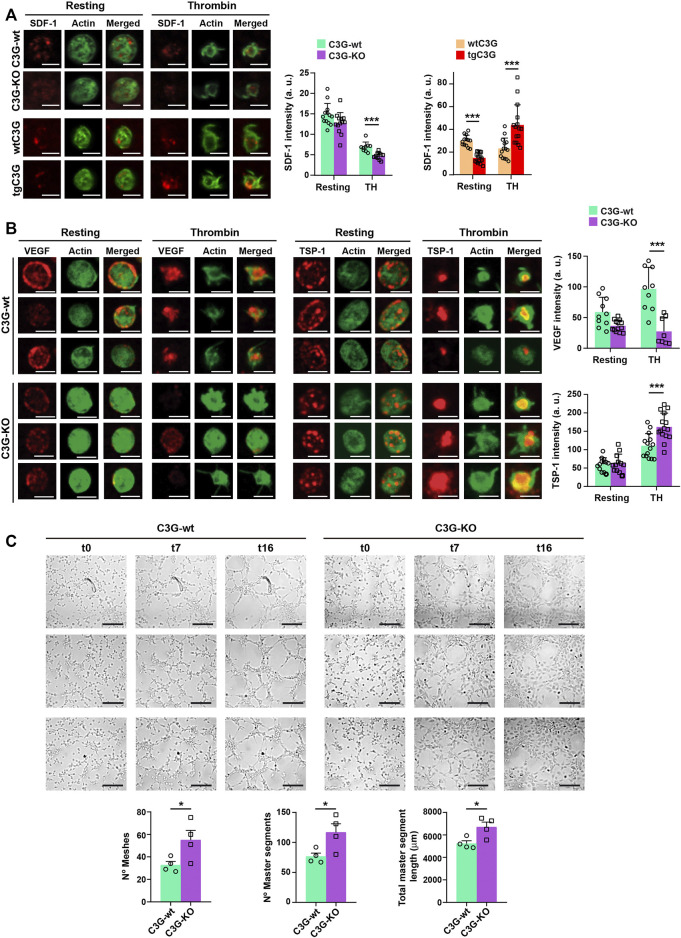
FIGURE 2.
C3G deletion enhances SDF-1 and VEGF release, while C3G overexpression retains SDF-1. (A) Representative immunofluorescence images of tgC3G, C3G-KO and control platelets, untreated or treated with thrombin (TH, 0.5 U/ml, 5 min) and stained with anti-SDF-1 + Alexa Fluor™-647 (red) and phalloidin-488 (green), taken at the same exposure time. Bar: 2.5 µm. Histograms represent the mean ± SD of SDF-1 fluorescence intensity. (B) Representative immunofluorescence images of C3G-KO and control platelets untreated or treated with thrombin (TH, 0.5 U/ml, 5 min) and stained with anti-TSP-1 + Alexa Fluor™-647 (red) or anti-VEGF + Alexa Fluor™-647 (red) and phalloidin-488 (green). All images were taken at the same exposure time. Bar: 2.5 μm. Histograms represent the mean ± SD of VEGF (upper) and TSP-1 (lower) fluorescence intensity. (C) Representative images showing the capillary-like structures formed by HUVECs supplemented with releasates from thrombin-stimulated C3G-KO and C3G-wt platelets. Images were taken every 15 min for 17 intervals. Intervals t0, t7 and t16 are shown, t0 corresponds to 1.5 h after releasate supplementation. Bar: 200 μm. Graphics show the mean ± SEM of different network characteristics determined at 2.5 h. Two independent experiments were performed. *p < 0.05; ***p < 0.001. a.u, arbitrary units.

