FIGURE 3.
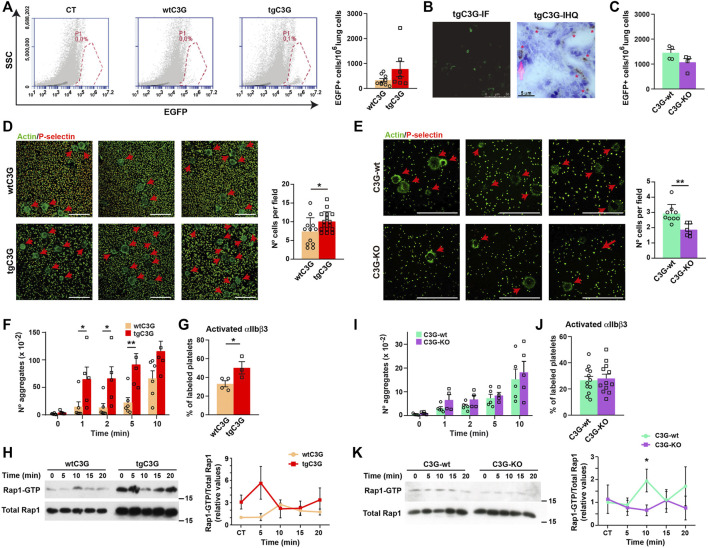
Platelet C3G favors an early onset of melanoma metastasis through regulation of melanoma cell adhesion and TCIPA. (A) Representative flow cytometry plots of lung homogenates from wtC3G and tgC3G animals injected with EGFP-expressing B16-F10 melanoma cells. CT: lung homogenates from untreated mice. Histogram represents the mean ± SEM of the number of EGFP+ cells in 1,000,000 lung cells. (B) Representative sections of lung tissue from tgC3G mice analyzed by immunofluorescence (IF, left) or immunohistochemistry (IHC) with anti-GFP antibodies (right). Presence of B16-F10 cells is indicated with asterisks. Bar: 5 μm. (C) Mean ± SEM of the number of EGFP+ cells in 1,000,000 lung cells from C3G-KO and C3G-wt mice. (D,E) Representative immunofluorescence images of B16-F10 cells adhered to poly-L-Lysine-coated plates, after co-culturing with tgC3G or wtC3G platelets (D) or C3G-KO and C3G-wt platelets (E), stained with anti-P-selectin + anti-goat Cy3 antibodies (to visualize platelets) and phalloidin-488 to detect actin. Arrows indicate the presence of B16-F10 cells. Bar: 50 μm. Histograms represent the mean ± SD of the number of B16-F10 cells per field. (F,I) Mean ± SEM of the number of platelet aggregates from the indicated genotypes upon stimulation with B16-F10 cells for the indicated time periods. (G,J) Mean ± SEM of the percentage of platelets with activated integrin αIIbβ3. (H,K) Platelets from the indicated genotypes were stimulated with 1 × 10³ B16-F10 cells and Rap1-GTP levels determined by pull-down assay. Left: representative western blots. Right: line/scatter plots of Rap1 levels (n=3). Values (mean ± SEM) are relative to those in non-stimulated wild-type platelets and were normalized to total Rap1 levels. *p < 0.05, **p < 0.01.

