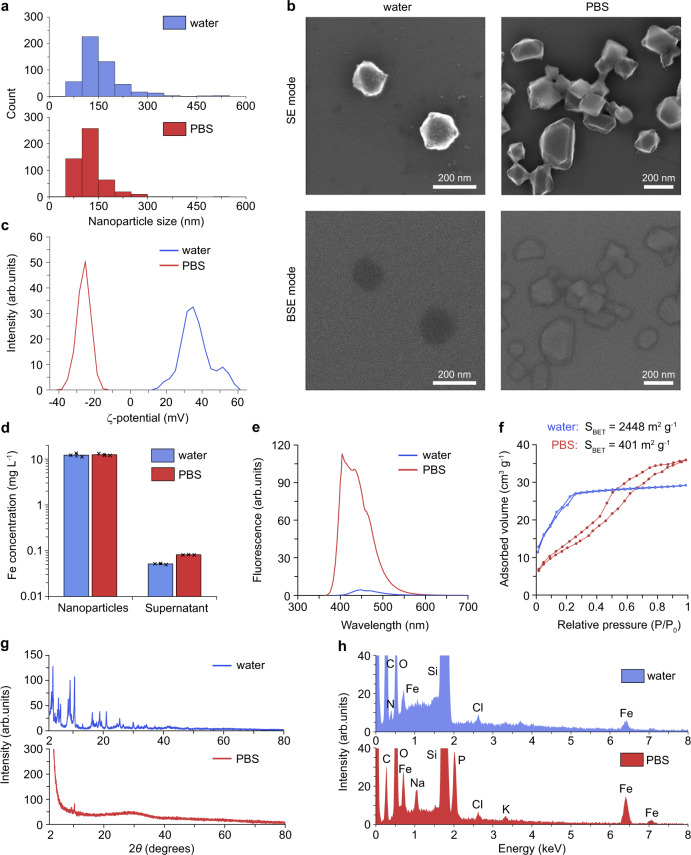
Fig. 3. MIL-101 nanoparticle degradation mechanism.
Results of MIL-101 nanoparticle (NP) degradation analysis after 24-h incubation in PBS and water at the concentration 200 mg L−1 are marked with red and blue, respectively (columns and lines). a Histograms of the particle size distribution based on scanning electron microscopy analysis (n = 1 experiment, 500 particles were analysed for each histogram). b Electron micrographs obtained using in-beam secondary electron (SE) mode (top row) and in-beam back-scattered electron (BSE) mode (bottom row) of MIL-101 NPs incubated in water (left) or PBS (right), n = 1 experiment. Scale bars = 200 nm. c The ζ-potential distributions of nanoparticles, n = 1 experiment, 3 repetitions. d Iron concentration in the dry and supernatant fractions from the MIL-101 NPs incubated in water or PBS, n = 3 samples. Data are presented as mean values ± SD. e Fluorescence spectra of 2-aminoterephtalic acid released from MIL-101 NPs into the supernatant. Excitation—315/10 nm. n = 1 measurement. f Brunauer–Emmett–Teller N2 adsorption/desorption isotherms of MIL-101 NPs. n = 1 measurement. g X-ray diffraction patterns of MIL-101 NPs. n = 1 measurement. h Energy-dispersive spectroscopy patterns of MIL-101 NPs. n = 1 measurement.

