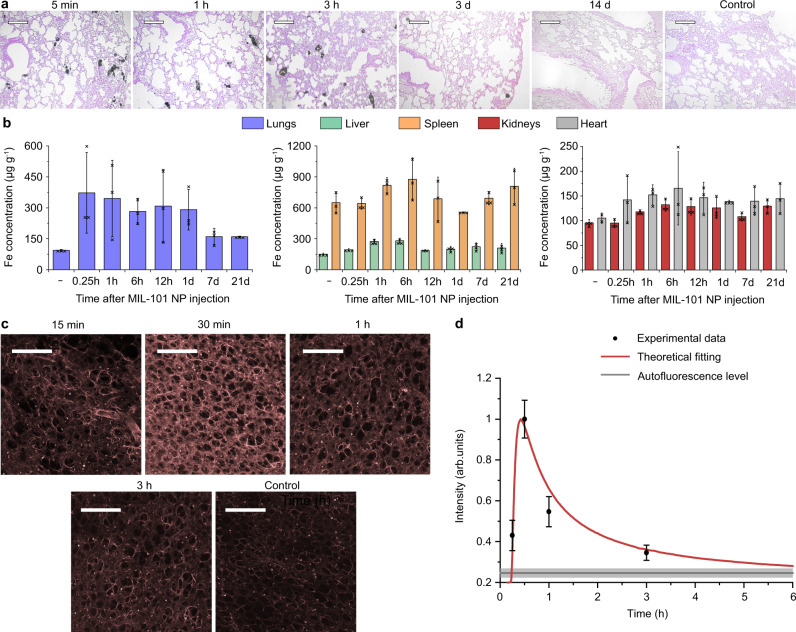
Fig. 5. Investigation of the drug delivery to the lungs using MIL-101 nanoparticles.
a Histological evaluation of the lung tissue at several time points, following the MIL-101 NP injection. The tissue slices were stained with eosin and Perls Prussian blue. n = 3 mice. Scale bars = 50 µm. b Evaluation of the iron concentration in the main organs after the MIL-101 NP injection: lungs (blue), liver (green), spleen (orange), kidneys (red), heart (grey). n = 3 mice. c Representative confocal images of rhodamine 123 distribution in the lung tissue at several time points following the MIL-101 NP injection. n = 3 mice. Fluorescence excitation/emission, 488/515-575 nm. Scale bars = 250 µm. d Kinetics of the mean fluorescence intensity of the lung tissue. Data were fitted using the developed theoretical model (red line). Grey line marks the mean ± SD tissue autofluorescence level. n = 3 mice. In b, d data are presented as mean values ± SD.

