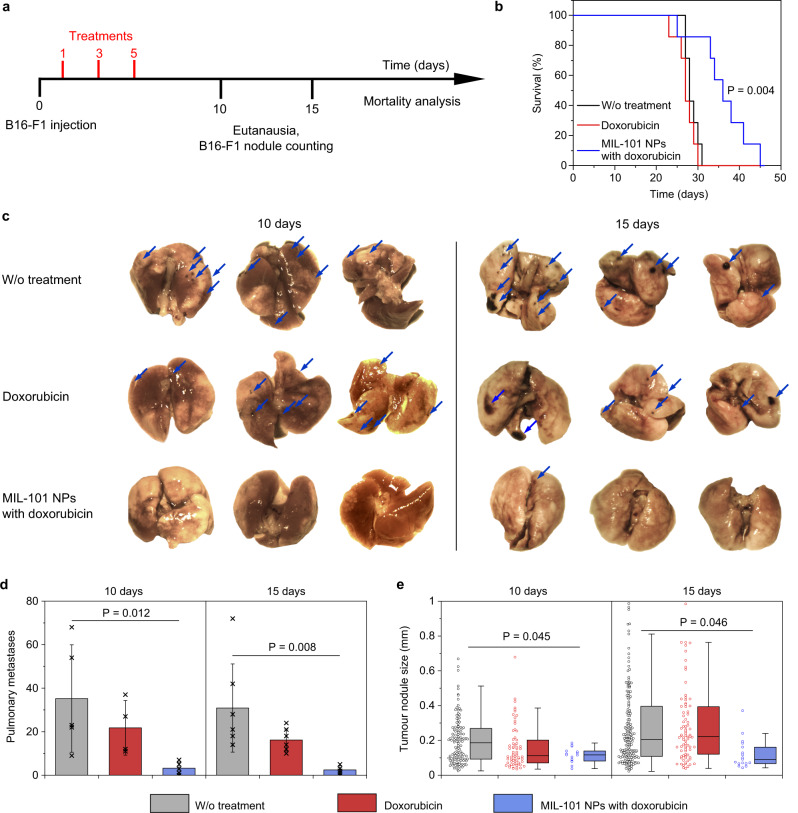
Fig. 6. Doxorubicin-loaded MIL-101 NPs effectively treat melanoma in early-stage pulmonary metastasis model.
a Treatment schedule. b Kaplan-Meier survival curves of mice after the treatment with PBS (black), doxorubicin (red) or doxorubicin-loaded MIL-101 NPs (blue). n = 7 mice per group. Two-sided log-rank test was used for statistical analysis. c Representative images of lungs, collected on Day 10 (left) or 15 (right) post cancer cell administration. Mice were treated with PBS (top line), doxorubicin (middle line) or doxorubicin-loaded MIL-101 NPs (bottom line). Blue arrows point to the melanoma metastases. n = 3 mice per group. d Quantification of the surface metastases in the harvested lungs on Day 10 and Day 15 after the treatment with PBS (grey), doxorubicin (red) or doxorubicin-loaded MIL-101 NPs (blue). Data are presented as mean values ± SD. e Analysis of the nodule size in the harvested lungs on Day 10 and Day 15 after the treatment with PBS (grey), doxorubicin (red) or doxorubicin-loaded MIL-101 NPs (blue). The boxplots represent median values, interquartile ranges and Tukey whiskers with individual data points superimposed. In d, e n = 4 mice for doxorubicin group on Day 10, n = 5 mice for the other groups on Day 10; n = 6 mice for all groups on Day 15. In e following metastases quantity was analysed in the mice lungs: 126, 66 and 15 for PBS, doxorubicin and doxorubicin-loaded MIL-101 NPs treated groups, respectively, on Day 10; 199, 85 and 17 for PBS, doxorubicin and doxorubicin-loaded MIL-101 NPs treated groups, respectively, on Day 15. One-way ANOVA with Tukey post-hoc test was used for statistical analysis.

