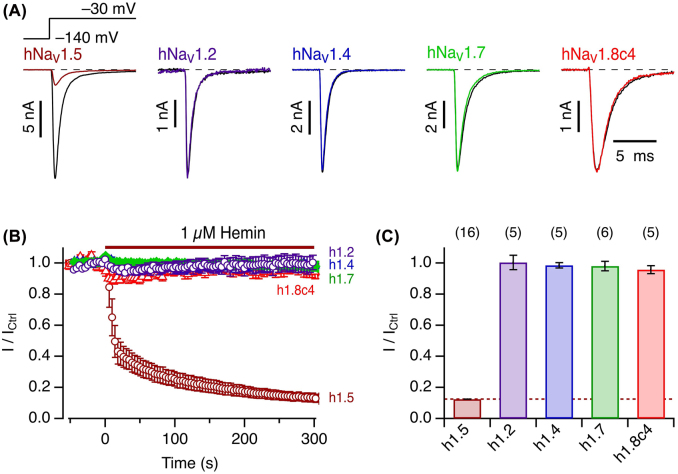
Figure 5:
Specificity for cardiac hNaV1.5 channels.
(A) Representative whole-cell currents according to the indicated pulse protocol before (black) and about 5 min after application of 1 µM hemin (color) for hNaV1.5, hNaV1.2, hNaV1.4, hNaV1.7, and hNaV1.8c4. (B) Mean time course of peak currents at −30 mV, recorded at intervals of 4 s, for the different channel isoforms as indicated by the colors as in (A). (C) Statistics for the mean remaining current after 5 min exposure to 1 µM hemin. Data in (B) and (C) are mean ± sem with n in parentheses (C).

