Fig. 2.

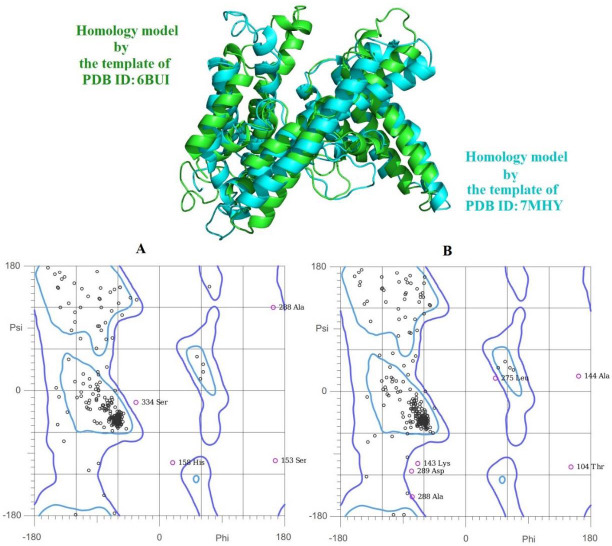
Superimpose position of two generated homology models by the template of PDB ID: 6BUI in green and the template of PDB ID: 7MHY in cyan. (A) and (B) are the Ramachandran plots of the two different homology models, respectively.

Superimpose position of two generated homology models by the template of PDB ID: 6BUI in green and the template of PDB ID: 7MHY in cyan. (A) and (B) are the Ramachandran plots of the two different homology models, respectively.