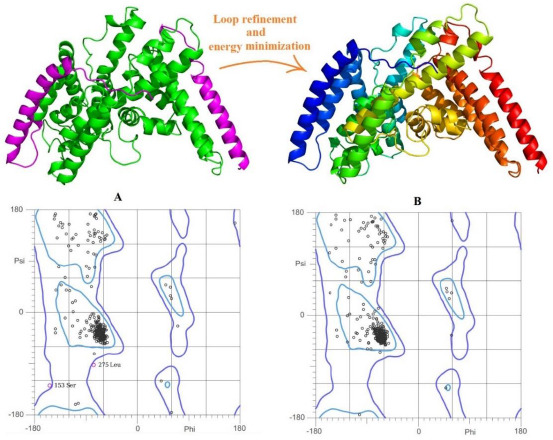
Fig. 3.

Homology modeling and the Ramachandran plots. (A) Generated homology model by the template of PDB ID: 6BUI in green the 3D structure of 70 missing residues was predicted and added by the AIDA web server in magenta color and its Ramachandran plots and (B) the final homology model after the loop refinement and energy minimization and related Ramachandran plots.
