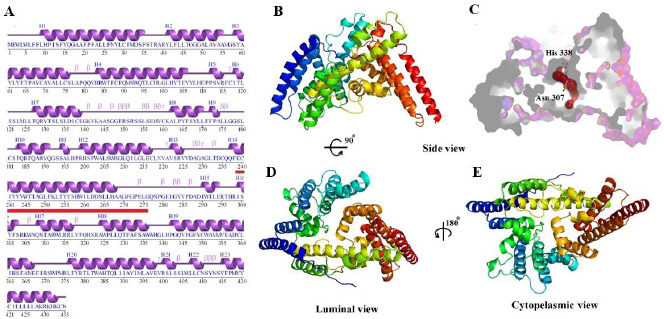
Fig. 4.

Sequence analyzing and the display of the homology model in luminal and cytoplasmic view. (A) Secondary structure analysis of ghrelin O-acyltransferase enzyme by the PDBsum server, the red line indicates the amino acids involved in the tunnel; (B) generated homology model of the enzyme from the side view; (C) the surface display of the homology model and predicted inside the tunnel; (D) and (E) are the luminal and cytoplasmic faces of the enzyme, respectively.
