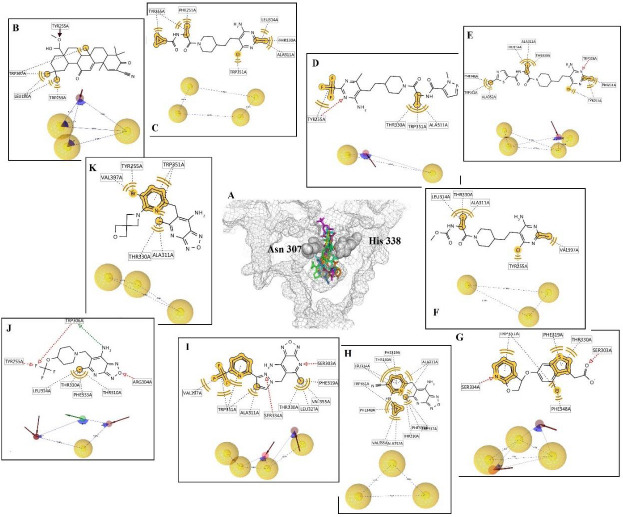
Fig. 6.

(A) The 3D display of the reported inhibitor in the active site of ghrelin O-acyltransferase enzyme. In the 2D display, the yellow line and sphere are related to hydrophobic interactions; the green and red dash indicate the hydrogen bond donor and acceptor, respectively. In the pharmacophore map, the yellow sphere means the hydrophobic area, and the green and red flashes mean the hydrogen bond donor and acceptor features, respectively. (B-K) compounds 1-10, respectively.
