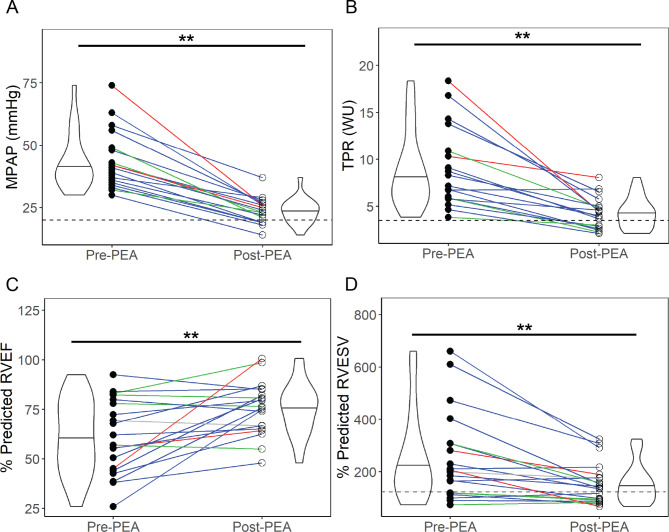
Fig. 2.
Hemodynamic and RV outcomes recovered to normal values in most patients with CTEPH post-pulmonary endarterectomy (PEA) for (a) mean pulmonary artery pressure (mPAP), (b) total pulmonary resistance (TPR), (c) % predicted right ventricular ejection fraction (RVEF), and (d) % predicted right ventricular end-systolic volume (RVESV) adjusted by sex, age, weight, and height [27]. Colored lines represent the San Diego classification of the PEA specimens for each patient – red = Type I, blue = Type II, green = Type III, grey = not recorded. Dotted lines in (a), (b), and (d) indicate healthy values of mPAP (< 20 mmHg), TPR (~ 3.5 WU), and % predicted RVESV (100%). Significant differences by t-test represented by *=p < 0.05, **=p < 0.01

