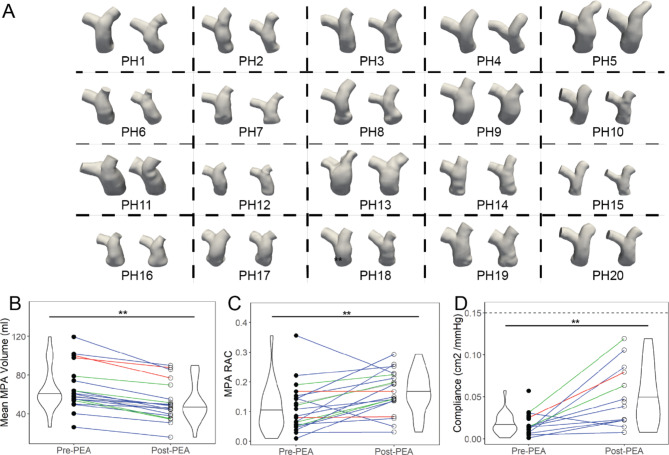
Fig. 3.
Volume and PA wall indices of patients with CTEPH changed post-PEA. (a) PA anatomies confined from the pulmonary valve to the first branch point in the left pulmonary artery (LPA) and right pulmonary artery (RPA) are shown at minimum volumes in the cardiac cycle for all patients with CTEPH (n = 20, first three rows, pre-PEA left, post-PEA right per box). Volumes of the (b) MPA decreased significantly post-PEA in patients with CTEPH. PA wall indices increased for the MPA (c) relative area change (RAC) and (d) compliance. The dotted line in (d) indicates healthy values of compliance (0.15 cm2/mmHg) [29]. Colored lines represent the San Diego classification of the PEA specimens for each patient – red = Type I, blue = Type II, green = Type III, grey = not recorded. *=p < 0.05, **=p < 0.01

