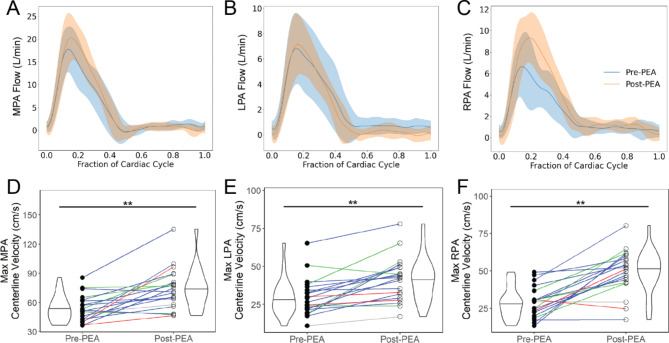
Fig. 4.
Flow waveforms averaged for all patients with CTEPH with high quality 4D flow CMR velocity (n = 15) pre-PEA (blue), post-PEA (orange) in the (a) MPA, (b) LPA, and (c) RPA where the solid line is the average, and the shaded region is the standard deviation. Centerline velocities in the (d) MPA, (e) LPA, and (f) RPA increased significantly post-PEA. Colored lines represent the San Diego classification of the PEA specimens for each patient – red = Type I, blue = Type II, green = Type III, grey = not recorded. Significant differences between groups denoted by: *=p < 0.05, **=p < 0.01

