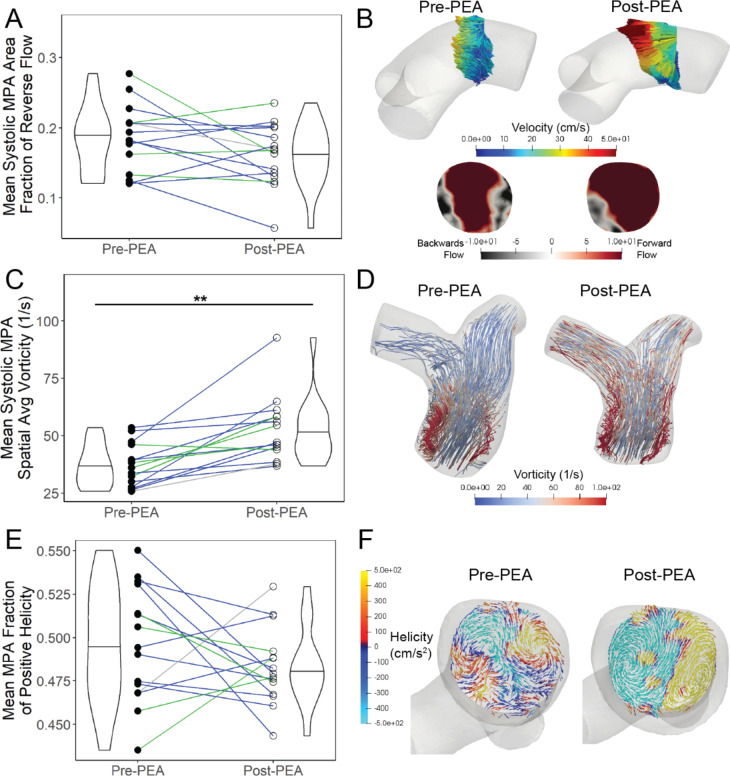
Fig. 5.
(a) The mean systolic area fraction of reverse flow in a slice in the MPA decreased slightly post-PEA. (b) A cross-sectional slice in the middle of the PA trunk taken during mid-systolic downstroke shows more reverse flow in a representative patient (PH18) pre-PEA than post-PEA. (c) The mean systolic spatially averaged vorticity in the MPA increased post-PEA. (d) Visually this is shown in a representative patient (PH7) pre- and post-PEA with streamlines colored by vorticity during peak vorticity. (e) The mean fraction of positive helicity was approximately half of the MPA volume for the pre/post-PEA group. (f) A cross-sectional MPA slice taken during systole with surface vectors projecting forward moving velocity onto the slice and colored by helicity shows distinct counter rotating structures in the post-PEA (PH18) condition as opposed to the pre-PEA condition. Colored lines (a, c, & e) represent the San Diego classification of the PEA specimens for each patient –blue = Type II, green = Type III, grey = not recorded. *=p < 0.05, **=p < 0.01

