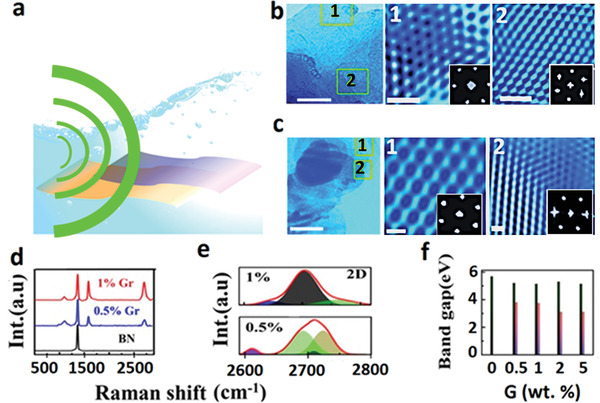
Figure 1.

a) Schematic diagram of sonochemical hybridization process. b) TEM image for 1 wt% of Gr‐BN and its HRTEM images in overlap areas marked in TEM as 1 and 2, insets corresponding to their FFT pattern. c) TEM image for 0.5 wt% Gr‐BN system overlapped areas confirmed by elemental mapping marked as 1 and 2 and their HRTEM images, in inset corresponding FFT patterns f) bandgap histogram for hybrid systems with different wt% (0 to 5 wt%) of Gr in BN obtained from UV‐visible measurements and d) Raman spectra for hybrids (0.5 to 1) wt% of Gr in BN and e) deconvolution of 2D peaks for hybridized (0.5 and 1 wt%) samples.
