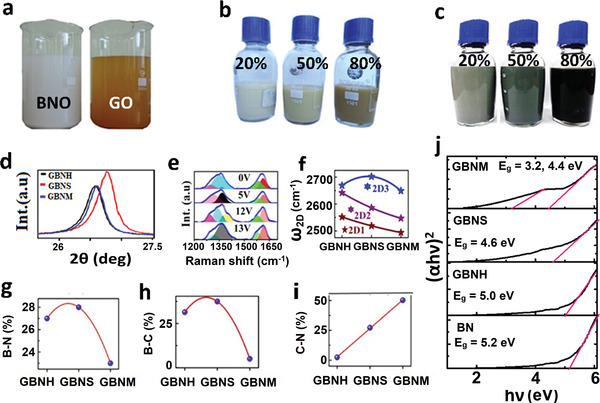
Figure 4.

a) Camera images of BNO and GO as synthesized by modified Hummer's method. b) Typical GBNH samples with 20%, 50%, and 80% of RGO in RBNO. c) Typical GBNM samples with 20%, 50%, and 80% of RGO in RBNO. d) XRD, e) electric field‐dependent modulation of Raman spectra of 50:50 GBNM hybrid. f) 2D sub‐peaks (deconvoluted) positions, g) B‐N %, h) B‐C %, and i) C‐N % attained by XPS analysis in GBNH, GBNS, and GBNM samples. j) Tauc plot for BN, GBNH, GBNS, and GBNM samples.
