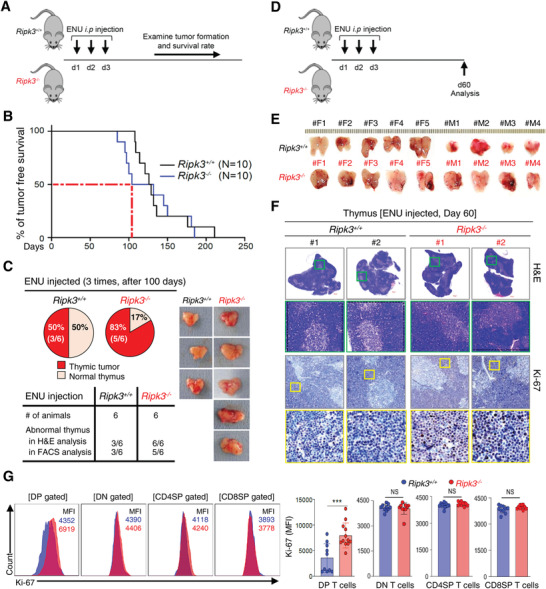
Figure 3.

Carcinogen‐induced thymic tumorigenesis was accelerated in RIPK3‐deficient mice. A) Intraperitoneal injection of ENU (N‐ethyl‐N‐nitrosourea) at around postnatal day 13 ∼15 (three‐time; 13∼15 day) was performed to both Ripk3+/+ and Ripk3−/− mice. B) Kaplan–Meier survival curve (Long‐rank test) after 3 consecutive daily ENU injections into Ripk3 wildtype and Ripk3 knockout mice (n = 10 for each group). Around 105 days after ENU injection, 50% of Ripk3−/− mice succumbed to tumors (red dotted line). C) All of animals were examined at 100 days after 3 consecutive daily ENU injection to Ripk3+/+ (n = 6) and Ripk3−/− (n = 6) mice. The summary of tumor incidence in this ENU injection experiment. 83% of the Ripk3−/‐ animals developed thymic lymphoma at the microscopic level. D) Schematic diagram of an ENU injection experiment. E) Gross view of the abnormally big thymus removed from ENU injected Ripk3+/+ and Ripk3−/− mice at day 60. Ripk3 −/− thymus showed a more hyperplasia than Ripk3+/+ thymus. F) Representative images of hematoxylin and eosin (H&E) stained sections and Ki‐67 staining of thymus from both ENU injected Ripk3+/+ and Ripk3−/− mice. G) Relative fluorescence of Ki‐67 in indicated thymic T cells (blue box in Ripk3+/+ and red box in Ripk3−/− ) analyzed by Flow Cytometry (n = 10 ∼ 12 for each group). Statistical analyses were performed using the two‐tailed unpaired Student t‐test or log rank test. P values below 0.05 were considered significant in the following manner: *p < 0.05, **p < 0.01, ***p < 0.001.
