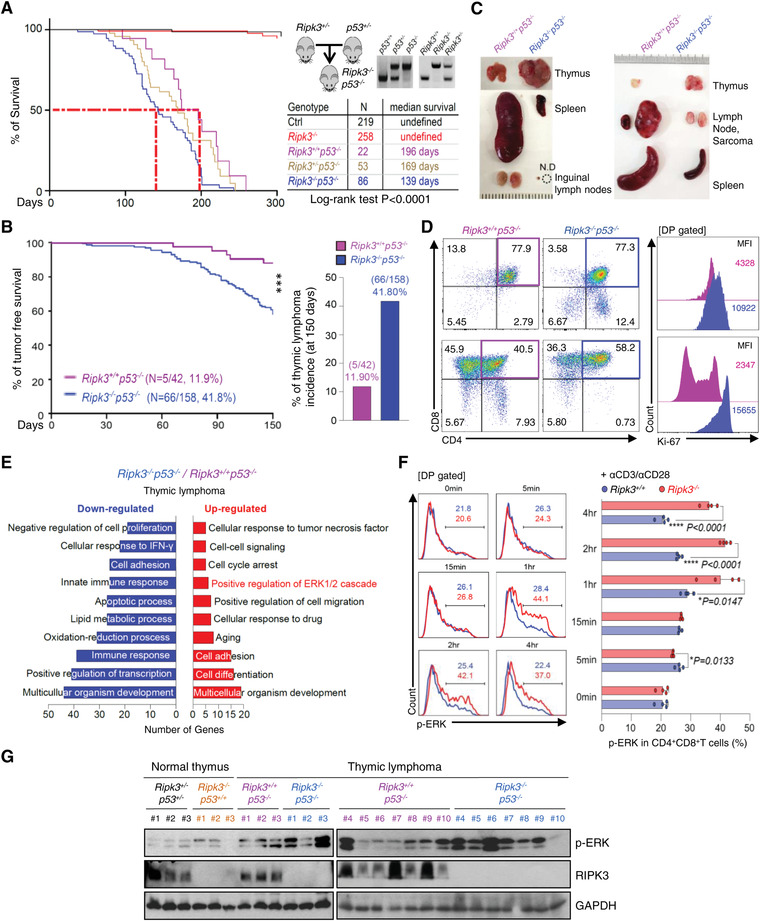
Figure 4.

RIPK3 deficiency enhances thymic lymphoma in p53‐deficient mice via ERK hyperactivation. A) Kaplan‐Meier survival curve (Long‐rank test) of animals in different genetic backgrounds including Ripk3+/+p53−/− and Ripk3−/−p53−/− animals. Red dotted line shows median survival of Ripk3+/+p53−/− and Ripk3−/−p53−/‐ mice, which are significantly different (p < 0.0001). B) The thymic lymphoma free survival curve and thymic lymphoma incidence of p53−/− and Ripk3−/−p53−/− animals until 150 days of age. The tumor‐free survival plot of Ripk3+/+p53−/− (n = 42) compared with Ripk3−/−p53−/‐ (n = 158) mice that are significantly different. C) Representative images of thymus, spleen and lymph node from tumor‐bearing Ripk3+/+p53−/− and Ripk3−/−p53−/− littermates. D) The phenotype of the thymic T cell populations (left panel). The thymic T cell from both Ripk3+/+p53−/− and Ripk3−/−p53−/− thymic lymphoma showed homogenous expansion in DP T cells but Ripk3−/−p53−/− DP T cells showed increased proliferation index (Ki‐67) (right panel). E) RNA sequencing analysis of up‐ and down‐regulated gene in Ripk3 −/− p53 −/− thymic lymphoma compared to p53 −/− thymic lymphoma. Analysis of up‐regulated gene shown the change in positive regulation of ERK signaling pathways. F) Total thymocytes from Ripk3+/+ (n = 4) and Ripk3−/− (n = 4) mice were stimulated with anti‐CD3 (1 µg mL−1) and anti‐CD28 (2 µg mL−1) or without for indicated time. Phosphorylation of ERK in DP T cell measured by Flow Cytometry. G) The protein expression levels of p‐ERK in normal thymus (Ripk3+/−p53+/− ; n = 3, Ripk3−/−p53+/+ ; n = 3) and thymic lymphoma (Ripk3+/+p53−/− ; n = 10, Ripk3−/−p53−/− ; n = 10) tissues were measured by Western blot analysis. Statistical analyses were performed using the two‐tailed unpaired Student t‐test or log rank test. p values below 0.05 were considered significant in the following manner: *p < 0.05, **p < 0.01, ***p < 0.001.
