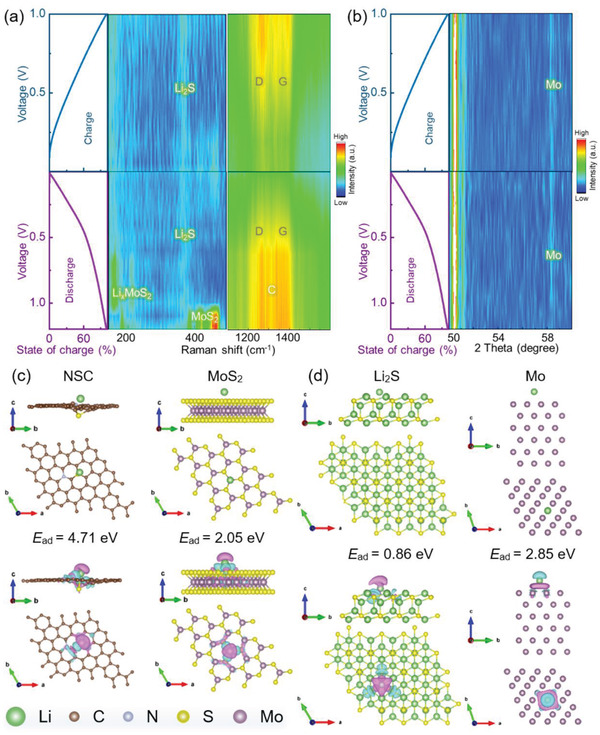
Figure 3.

a) Galvanostatic charge–discharge (GCD) plots of the MoS2@NSPCB host at 0.1 A g−1 and the corresponding in situ Raman spectra. b) GCD plots of the MoS2@NSPCB host at 0.1 A g−1 and the corresponding in situ XRD patterns. Top and side views of different geometries, real‐space charge densities, and E ad values of Li atoms on c) NSC, MoS2, d) Li2S, Mo. The purple and blue colors, respectively, represent decreases and increases in the charge densities.
