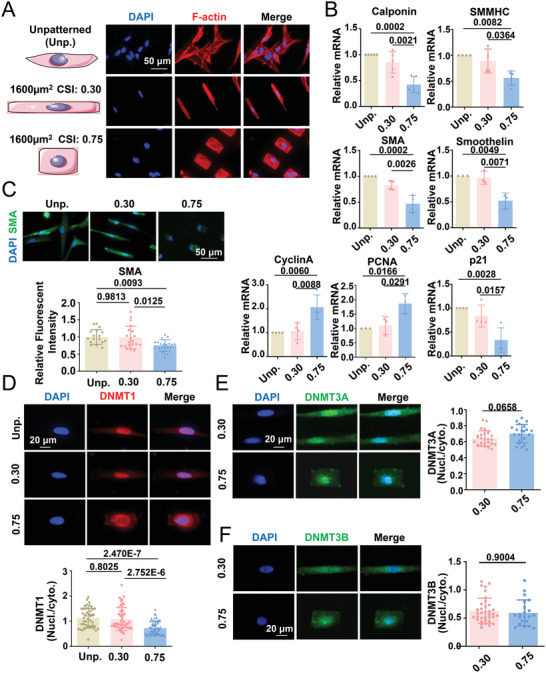
Figure 1.

Geometric constraints induce changes in vascular smooth muscle phenotype and the subcellular distribution of DNA methyltransferase (DNMT) 1. A) Representative fluorescent staining of F‐actin in unpatterned (Unp.) and micropatterned (CSI = 0.30 and CSI = 0.75) smooth muscle cells (SMCs). B) The mRNA levels of genes determining the smooth muscle phenotype were measured using quantitative RT‐PCR. Data were obtained from three to five biological repeats. C) Representative immunofluorescence staining and quantification of the expression of the smooth muscle contractile gene, smooth muscle alpha‐actin (SMA). D–F) Representative immunofluorescence staining and quantification of the nuclear/cytoplasmic ratio of DNMT1, DNMT3A, and DNMT3B. In (D)–(F), each dot represents a single cell. Fluorescence images were acquired using an epifluorescence microscope. Significance was assessed using E,F) a Student's t‐test and B–D) one‐way ANOVA with Tukey's post hoc analysis. The error bars show ± SD. The exact P values between the indicated groups are presented.
