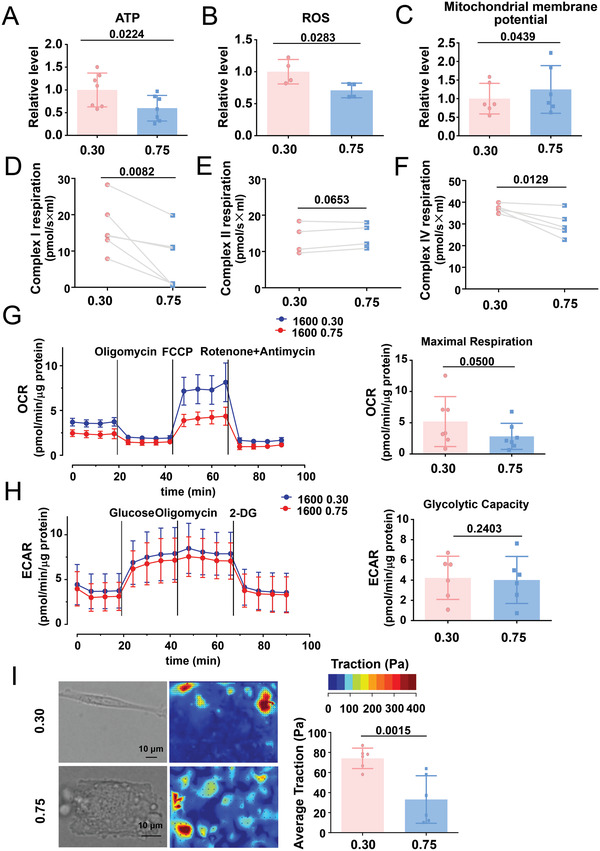
Figure 4.

Cells with different geometry differ in mitochondrial function and energy metabolism. A) Intracellular adenosine triphosphate (ATP) content in the micropatterned SMCs was evaluated using a photometer. Data were obtained from seven biological repeats. B) The production of reactive oxygen species in micropatterned cells was assayed using flow cytometry. Data were obtained from four biological repeats. C) The mitochondrial membrane potential was measured using flow cytometry. Data were obtained from six biological repeats. D–F) Complex I‐, II‐, and IV‐supported respiration was analyzed by Oroboros Oxygraph‐2k, a high‐resolution respiration analyzer. Data were obtained from five biological repeats. G) Representative traces of the oxygen consumption rate (OCR) measured using the Seahorse XF96 flux analyzer. Mitochondrial effectors were injected sequentially at the time points indicated by the arrows, and the maximum OCR was analyzed. Data were obtained from seven biological repeats. H) Representative traces of the extracellular acidification rate (ECAR) measured using the Seahorse XF96 flux analyzer. Mitochondrial effectors were sequentially injected at the time points indicated by the arrows. The glycolytic capacity was analyzed. Data were obtained from seven biological repeats. I) Traction force microscopy assay to detect cellular contractility in micropatterned SMCs. Representative bright field images and cell force images are presented in the left panel. Quantification of the traction is shown in the right panel. Each dot represents a single cell. Significance was assessed using A–C,G–I) the Student's t‐test or D–F) paired t‐test. The error bars show ± SD. The exact P values between the indicated groups are presented.
