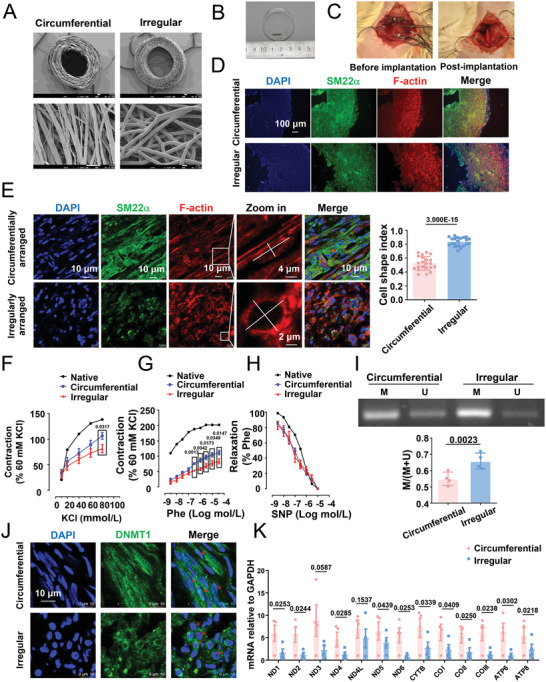
Figure 5.

In circumferentially/irregularly arranged vascular grafts, the geometry of SMCs is related to mtDNA methylation or vessel contractility. A) Micrographs obtained using scanning electron microscopy (SEM) showing the structure of the cross‐section/longitudinal section of the circumferentially/irregularly arranged vascular grafts. B) A gross image of the grafts. C) Implantation surgery (before and post) in Sprague–Dawley rats. D) Representative immunofluorescence staining of the smooth muscle phenotypic marker SM22α at 3 months after implantation. E) Representative immunofluorescence staining of SM22α and F‐actin at 3 months after implantation. The calculation of the SMC cell shape index in the grafts is shown in the right panel. Each dot represents a single cell. F,G) KCl‐ and phenylephrine (Phe)‐stimulated vasoconstriction in the graft segments and native vessels. H) Sodium nitroprusside‐stimulated vasodilation in the graft segments and native vessels. In (F)–(H), data were obtained from eight animals. I) Representative agarose gel electrophoresis of the products of MSP for the D‐loop of bisulfite‐modified DNA isolated from circumferentially aligned or irregularly arranged vascular grafts. Semi‐quantification of the MSP results is presented in the right panels. M: methylated, U: unmethylated. Data were obtained from four animals. J) Representative immunofluorescence staining of DNMT1 in the grafts at 1 month after the implantation. The red arrows indicate the nuclear distribution of DNMT1 in the circumferentially aligned grafts and the cytoplasmic distribution of DNMT1 in the irregularly arranged vascular grafts. K) Quantitative RT‐PCR for assessing the expression of mtDNA genes in the grafts at 1 month after implantation. Fluorescence images were acquired using E,J) a confocal microscope or D) an epifluorescence microscope. Significance was assessed using a Student's t‐test. The error bars show ± SD. The exact P values between the indicated groups are presented.
