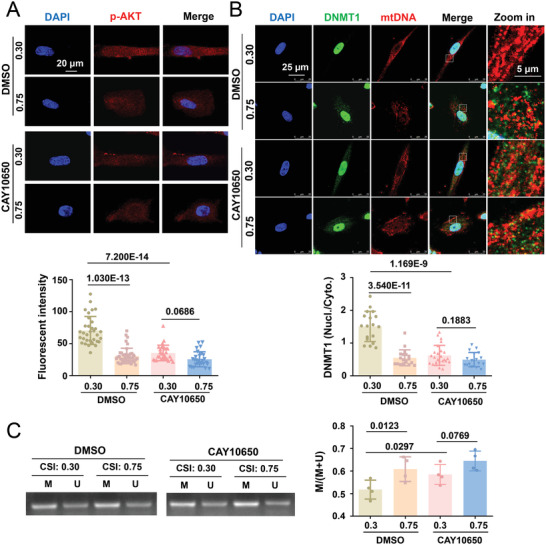
Figure 9.

cPLA2 inhibition blocks the geometry‐regulated DNMT1 redistribution and mtDNA methylation. A) Representative immunofluorescent staining (upper panels) and quantification (lower panel) of p‐AKT in micropatterned cells treated with a cPLA2 inhibitor (CAY10650, 12 nmol L−1) or the control reagent (DMSO) for 1 h. B) Representative immunofluorescence staining (upper panels) and quantification (lower panel) of the nuclear/cytoplasmic ratio of DNMT1 in micropatterned cells treated with CAY10650 or DMSO. C) Representative agarose gel electrophoresis of the products of MSP for the D‐loop of bisulfite‐modified DNA isolated from micropatterned cells treated with CAY10650 or DMSO. Semi‐quantification of the MSP results is presented in the right panel. M: methylated, U: unmethylated. Data were obtained from four biological repeats. Fluorescence images were acquired using a confocal microscope. In (A, B), each dot represents a single cell. In (C), data were from four biological repeats. Significance was assessed using two‐way ANOVA with Tukey's post hoc analysis. The error bars show ± SD. The exact P values between the indicated groups are presented.
