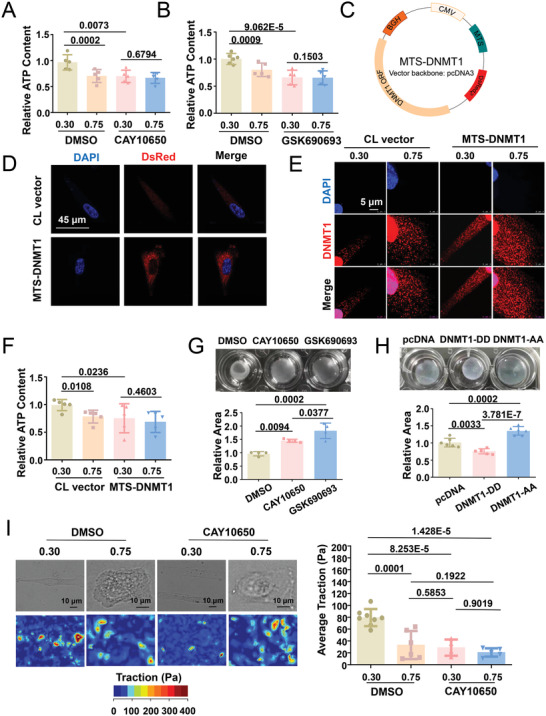
Figure 10.

Intervention of the cPLA2‐AKT1‐DNMT1 pathway affects ATP production and cell contractility. A,B) Measurement of the intracellular ATP content of micropatterned SMCs subjected to the indicated treatments. Data were obtained from five biological repeats. C) Schematic representation of the MTS‐DNMT1 construct. MTS, mitochondrial targeting sequence, CMV cytomegalovirus promoter, ORF open reading frame. D) Representative immunofluorescent staining of Discosoma sp. red fluorescent protein (DsRed). Cells were transfected either with pcDNA (CL vector) or with MTS‐DNMT1. E) Representative immunofluorescence staining of DNMT1 in micropatterned cells transfected with the CL vector or MTS‐DNMT1. F) Measurement of the intracellular ATP content of micropatterned cells with pcDNA or MTS‐DNMT1 transfection. Data were obtained from five biological repeats. G) Gel contraction assay with cells with the indicated treatments. Quantifications from four biological repeats are shown in the lower panels. H) Gel contraction assay with cells subjected to DNMT1‐AA or DNMT1‐DD transfection. Quantifications from six biological repeats are shown in the lower panels. I) Traction force microscopy assay to detect the cellular contractility of micropatterned cells treated with CAY10650 (a cPLA2 inhibitor) or DMSO. Representative bright field images and cell force images are presented in the left panel. Quantification of the traction is shown in the right panel. Each dot represents a single cell. Fluorescence images were acquired using a confocal microscope. Significance was assessed using one‐way or two‐way ANOVA with Tukey's post hoc analysis. The error bars show ± SD.
