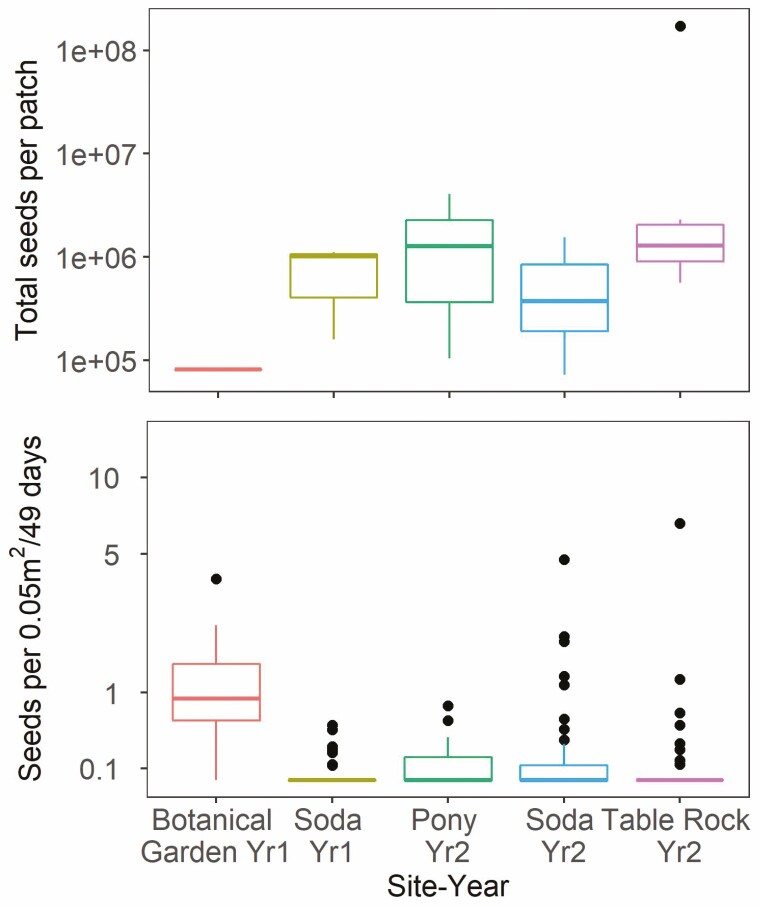
Figure 3.
Box plots of the estimated total available seeds per patch (fecundity × number of reproductive plants) across sites (top) and number of seeds across traps of all distances caught per 0.05 m2 trap area standardized by 49 days deployed (bottom). The graphs do not include under-crown traps. The unit of measure for the top graph is a patch (n = 19) and the unit of measure for the bottom graph is a trap (seed counts aggregated across heights, n = 273). Alkie was excluded due to seed crop failure and no seeds trapped.

