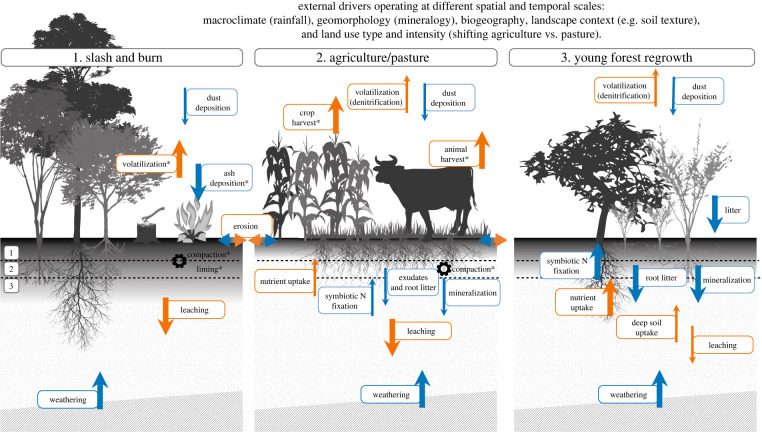
Figure 1.
Conceptual diagram showing how nutrient (nitrogen, phosphorus) flows (arrows) change during three different phases: (1) slash and burn, (2) use as cropland (left) and pasture (right) and (3) young forest regrowth. Flows are indicated as inputs (blue arrows) and losses (orange arrows) to the soil system. Flows can be determined by different processes, e.g. decomposition [5], nitrogen fixation [6], mycorrhizal activity [7] and dust trapping [8]. Erosion can lead to nutrient input or loss, depending on the topographic position of the plot. Other processes affecting soil structure and chemistry (e.g. compaction, liming) are indicated by gears (or wheels). The magnitude of the flow is indicated by the size of the arrow. Most processes occur in all stages, and asterisks (*) indicate that the process is unique to a stage. The soil layers consist of bedrock (hatched), mineral soil (dotted) and the accumulation of organic matter in the top mineral soil layer (greyscale). Dashed lines and numbers refer to the two layers studied: (1) topsoil (0–15 cm depth) and (2) subsoil (15–30 cm depth); (3) refers to deep soil (not studied). The shifting cultivation cycle is affected by a hierarchy of external drivers (indicated on top) that operate from regional to local spatial scales, and from long to short temporal scales. Drivers included in this study are indicated in parentheses. (Online version in colour.)

