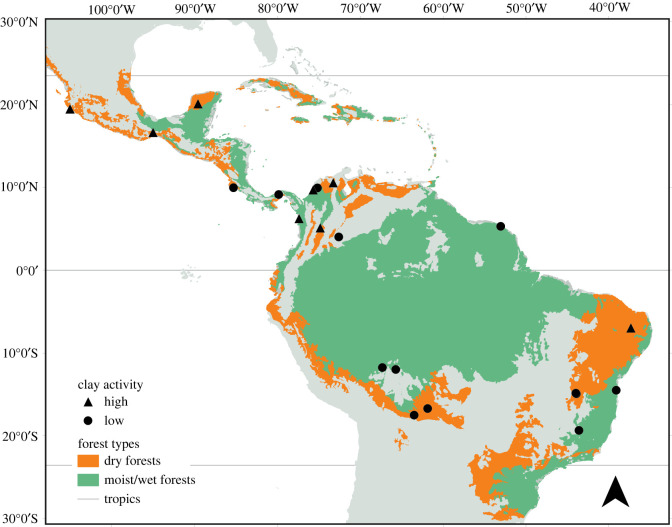
Figure 2.
Map showing the locations of the 21 chronosequence sites. The orange background layer shows dry tropical forest area and the green background layer shows moist or wet tropical forest area. The symbols refer to the clay activity type: circles for low-activity clays and triangles for high-activity clays. (Online version in colour.)

