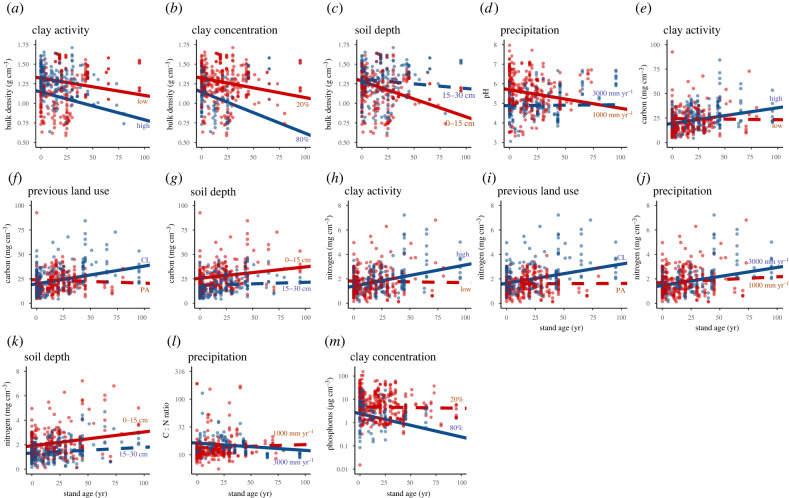
Figure 4.
Visualization of the significant interactions between recovery (i.e. the differences in soil properties between old-growth forest and agricultural land) and predictor variables on the soil properties. For the continuous predictor variables (i.e. clay, precipitation), the predictions are given for an arbitrarily chosen low (red) and high (blue) value. Prediction means are shown (N = 174). The interactions between the two lines in each graph are significant. Continuous lines indicate slopes significantly different from 0, whereas dashed lines indicate slopes that are not significantly different from 0. The predictor variables are: clay activity (red = low, blue = high), previous land-use type (red = pasture (PA), blue = cropland (CL)), soil depth (red = 0–15 cm, blue = 15–30 cm), precipitation (red = 1000 mm yr−1, blue = 3000 mm yr−1) and clay concentration (red = 20%, blue = 80%). Predictions are made across the average of all other variables. The data points are coloured by level of the interaction variable. For clay concentration, red < 40% and blue > 40%, and for precipitation, red < 2000 mm yr−1 and blue > 2000 mm yr−1. Statistics can be found in electronic supplementary material, appendix S9. (Online version in colour.)

